1
Managing Projects
SIM335
Prepared by: TRAN THI MAI THANH
Student ID: 119107003/1
Submission Date: 9 th
January, 2012
_________________________________________________________________
Number of Words:
Part A: 720
Part B: 2,850
2
Part 1:
The Network Diagram Information
3
Table of Contents
TITLE PAGE ....................................................................................................................................................... 2
TABLE OF CONTENTS ..................................................................................................................................... 3
1. NETWORK DIAGRAM .............................................................................................................................. 4
2. TIMING OF ACTIVITIES .......................................................................................................................... 6
3. PROJECT DURATION AND CRITICAL PATH ...................................................................................... 6
4. EARLIEST FINISH DATE ......................................................................................................................... 7
5. EFFECTS ON THE PROJECT'S DURATION .......................................................................................... 7
6. BENEFITS AND LIMITATIONS OF NETWORK DIAGRAM ................................................................ 7
REFERENCES ..................................................................................................................................................... 9
APPENDIX: CALENDAR AND USE OF PROJECT MANAGEMENT SOFTWARE................................... 10
4
1. Network Diagram
In order to make this companyâs project clearly, "Activity-on-Nodeâ technique (refer to
Field & Keller, 2007, pp. 197-202) is used to draw network diagram. The detail is as following:
5
Chart 1: Network Diagram
4 5 9
8 4 13
4 4 8 34 7 41
9 5 13 34 0 41
0 4 4 4 8 12 13 13 26 26 8 34 41 8 49 49 13 62 62 9 71 71 4 75 75 4 79 79 9 88 88 5 93
Start Finish
0 0 4 5 1 13 13 0 26 26 0 34 41 0 49 49 0 62 62 0 71 71 0 75 75 0 79 79 0 88 88 0 93
34 6 40
4 6 10
35 1 41
7 3 13
4 9 13
4 0 13
M N O P QG H
I
J
K LA D
B
C
E
F
6
2. Timing of Activities
All timing of activities is identified by using forward pass and backward pass
methods. The forward pass start with the project start activity and run forward from left to
right, the earliest start time (EST) at any node is equal to the biggest earliest finish time
(EFT) of...
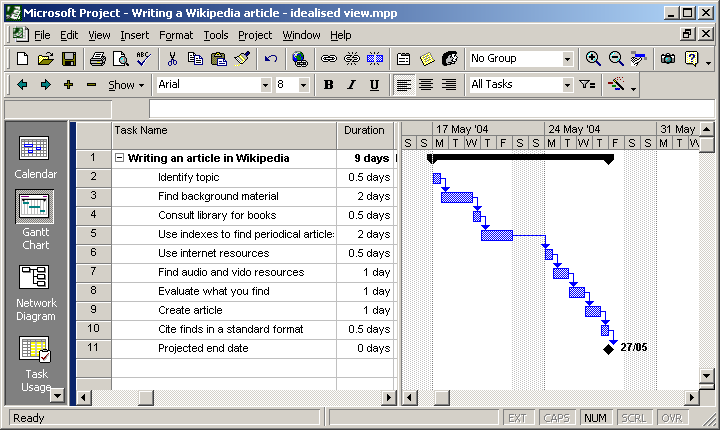 Microsoft Project 2000, showing a Gantt chart
 A network diagram created using Microsoft Project ...
 Pert diagram nakreslený v Microsoft Visio