Process Improvement Plan � PAGE \* MERGEFORMAT �1�
Running Header: PROCESS IMPROVEMENT PLAN
Process Improvement Plan
Stephen Kiser
University of Phoenix
March 15, 2009
�
Statistical process control attempts to use statistical techniques to interpret data that has been collected. The primary tool to accomplish this task is using the control chart as a graphical representation of the descriptive statistics involved with the data that has been collected. In this case the data was obtained over the previous weeks and deals with the time that it takes from awakening every morning to the point of being ready to open the center. This paper will attempt to illustrate how the data collected over the previous week can be used to illustrate the effects that the changes made to the flow chart have affected the process.
Discussion of Obtained Data
The first bit of data that needs to be used when attempting to develop a graphical representation deals with the information that has been gathered over the previous weeks.
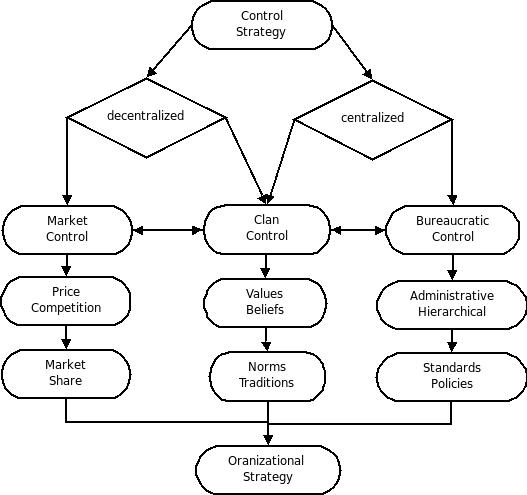 English: Control Strategy Diagram
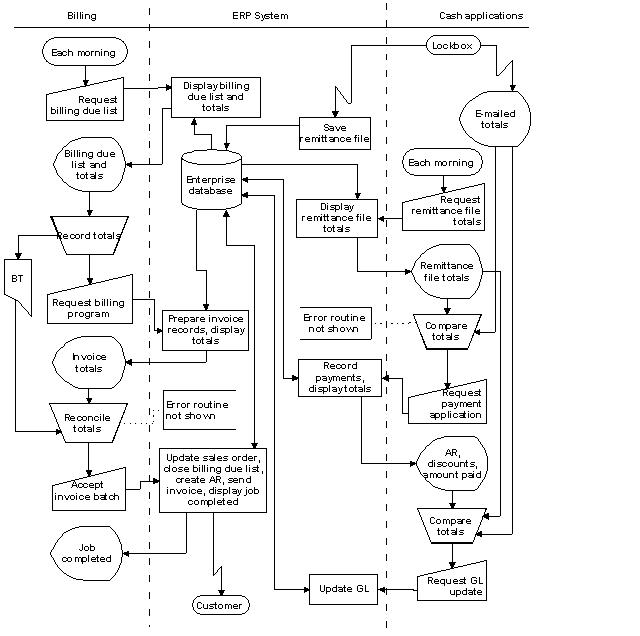 English: stockbridge systems flow chart example
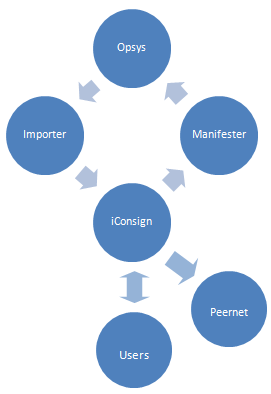 English: iConsign data flow chart
The following is a chart of the information obtained during those weeks:
Day1 | Day2 | Day3 | Day4 | Day5 | Sample Means | Sample Ranges | |
Week1 | 3.4 | 2.59 | 2.65 | 3 | 3.3 | 2.988 | 0.81 |
Week2 | 2 | 1.9 | 1.9 | 2.5 | 1.94 | 2.048 | 0.6 |
Week3 | 1.8 | 1 | 0.94 | 1.3 | 2 | 1.408 | 1.06 |
Week4 | 0.96 | 1.45 | 1.4 | 0.95 | 1.3 | 1.212 | 0.5 |
The information obtained within this graph was obtained over the five days during the week in which the process had to be completed. Once the information was obtained this allows for the sample means to be figured by adding the values from each day and then dividing them by the number of days during the week that data was obtained. The sample range is figured by subtracted the lowest value from each week from the largest value during the same...