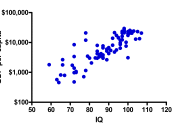
I. Crosstabulating VariablesA. In the simplest case, a bivariate (two-variable) distribution, showing the distribution of one variable for each category of another variable; can also be elaborated using three or more variables1. the "body" of the tablea. part between the row and column labels and the row and column totals2. the "cells" of the tablea. defined by combinations of row and column values3. Marginal distributionsa. summary of distributions in the margins of a crosstab that correspond to the frequency distribution of the row variable and of the column variableB. Graphing Association1. efficient tool for summarizing relationships among variablesa. race & regionb. relationshipsC. Describing association (4 aspects of the association between two variables)1. Existencea. does the percentage distributions vary at all between categories of the independent variable?2. Strengtha. how much do the percentage distributions vary between categories of the independent variable?3. Directiona. for quantitative variables, do values on the dependent variable tend to increase or decrease with an increase in value on the independent variable?4.
Patterna. for quantitative variables, are changes in the percentage distribution of the dependent variable regular (increasing or decreasing)b. do they vary (increasing then decreasing) (slowly increase then rapidly increase)D. Evaluating Association1. Measure of Associationa. type of descriptive statisticb. used to summarize the strength of an association2. Many Levels of Associationa. Gammai. value varies from -1 (perfectly associated in an inverse direction)ii. 0 (no association of the type that gamma measures)iii. +1 (perfect positive association of the type that gamma measures)b. statistical significance (refered to as "alpha")i. an association not likely to be due to chanceii. the probability level that will be used to evaluate statistical significanceiii. conventional statistics use an alpha level of .05c. chi squarei. inferential statistic that is used in most crosstabular analysesii. the probability that a relationship is due to chance3. Type I Errora.


More on quantitative research
Quantitative research uses methods adopted from the physical sciences that are designed to ensure objectivity, generalizability and reliability. These techniques cover the ways research participants are selected randomly from the study population in an unbiased manner, the standardized questionnaire or intervention they receive and the statistical methods used to test predetermined hypotheses regarding the relationships between specific variables. The researcher is considered external to the actual research, and results are expected to be replicable no matter who conducts the research.
Reference: www.socialmarketing.com
0 out of 0 people found this comment useful.