Uncertainties The measured mass was relatively exact. There was only some small uncertainty because of the additional mass of the rope that was holding the mass. The uncertainty of the time period was due to irregularities of the motion and due to uncertainty in time measurement. Time was measured for ten swings, thus the time period was this time divided by ten. This was done two times per mass; the two values were then averaged to achieve higher certainty.
Analysis By inspection of the graphs, the relationship between time period and mass was found to be close to: T õ (SQRT(m))-1 The inverse was suggested by the graph T vs. m, which looked parabolic. The square root made a better fit to a line (see T vs. T õ (SQRT(m))-1 graph) than just an inverse.
Conclusion The range of data points was quite good: the largest value of the independent variable was more than three times as big as the smallest value.
 Mass Effect: Reaper Assault
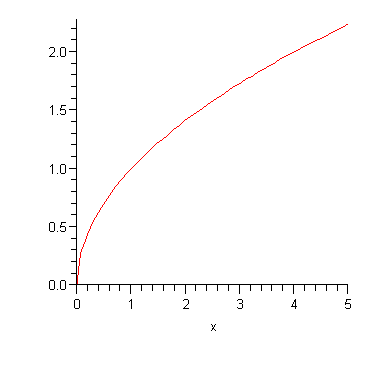 Dansk: kvadratrodsfunktion
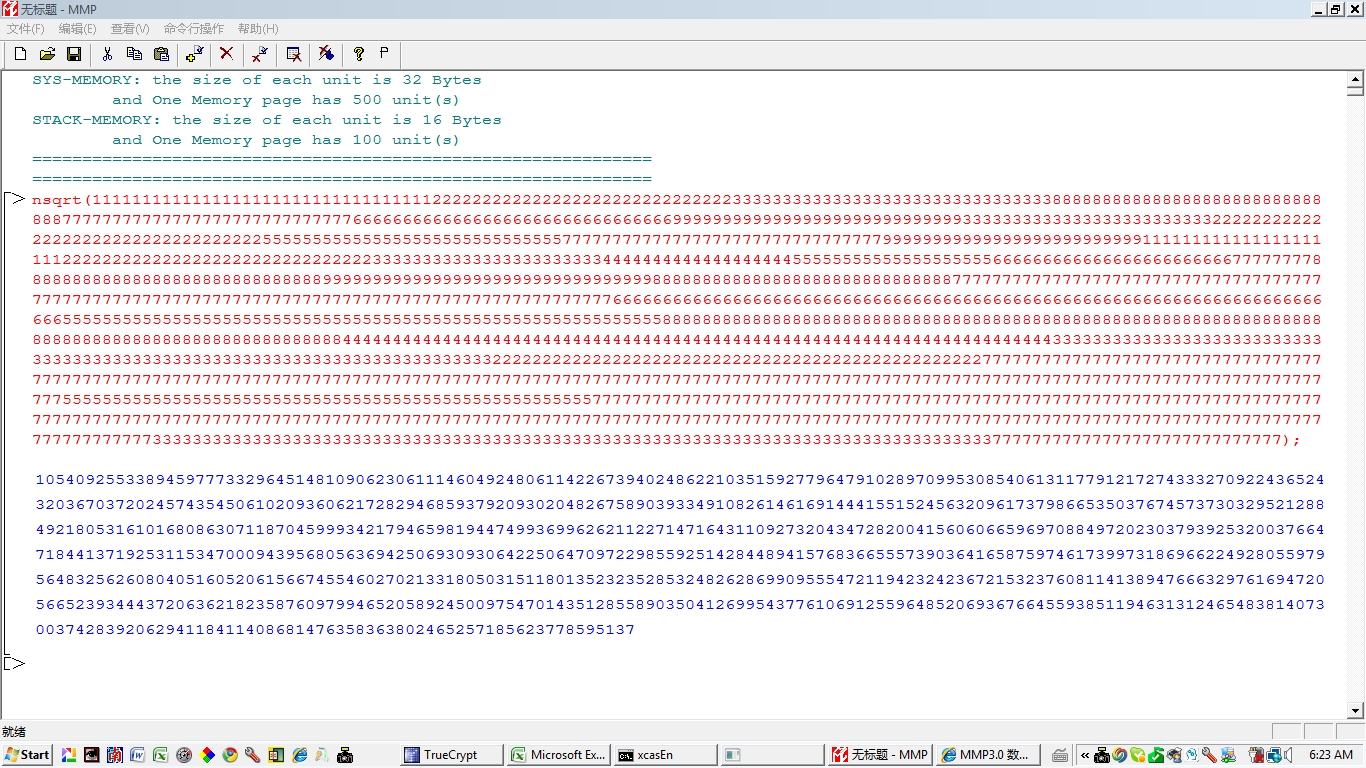 English: square root of large number
The size of the uncertainty bars was enough to see that there was no linear but an exponential relationship between time period and mass, but still not enough to make a 100% claim of the suggested relationship. The line fits well to the suggested relationship, the uncertainty bars could have been even smaller to still fit the line. The certainty of the acquired data is enough to claim an exponential relationship. However, there is not enough certainty to 100% claim that there should be a square root.
![riemann surface of Sqrt[z], projection from 4dim C x C to 3dim C x Re(C), color is argument](/uploads/11/116549/riemann-surface-sqrt-z-projection-4dim-c-x-c-3dim-c-x-re-c-c.jpg) riemann surface of Sqrt[z], projection from 4dim C...
riemann surface of Sqrt[z], projection from 4dim C...![function Sqrt[z] in the complex plane](/uploads/11/116549/function-sqrt-z-complex-plane.jpg) function Sqrt[z] in the complex plane
function Sqrt[z] in the complex plane