For the Showtime Rotisserie and Grill, our main interest right now is recent college graduates. As defined by the client, we are interested in those young adults within the ages of 18 to 30 who recently graduated from college and are entering the job market or those that just recently entered the work force. We are concerned with those individuals that are setting up their own places to live and those that plan to do so shortly.
At first we formed a focus group in order to see what a small amount of college graduates thought about the infomercial and the product itself. Through their insights, we were able to form hypotheses that helped us to create the questionnaire that will be used in this project. We are extremely interested in whether the male and female differences picked up in the focus group will remain throughout the study. After each team formed questionnaires, they were analyzed until one new one was created.
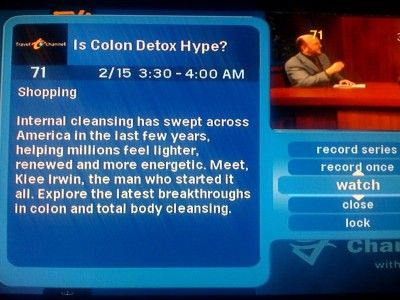 An example of a synopsis of an infomercial within ...
 ScoopIt, REVELN, dnrevel ~ Curation news
 English: Rejection Sampling method Français : Mé...
Everyone then picked that apart, until the final survey could be formed which is what is going to be used in this study.
The hypotheses that were used to create the questionnaires were first formed by four individual teams. Later all the teams collaborated in order to form one joint set of hypotheses. What first started out at about 70 different hypotheses was narrowed down to twenty-four. The following are the twenty-two hypotheses decided upon by the whole.
1. A convincing audience within the infomercial will be one that is made up of a majority of the target audience.
2. All prices of accessories should be given in the infomercial to aid in the decision making process.
3. Infomercial hosts should be closer in age to the target market.
4. The number of testimonials should be reduced.
5. It would increase the credibility of the testimonials is a disclaimer was shown to verify that the people giving the testimonials were not being paid.
6. Consumers are concerned with hidden costs not explained within the infomercial.
7. It would aid in the purchasing decision if consumers better understood the value that they were receiving for their money.
8. Consumers will use this product at least twice per month.
9. The rotisserie is seen as having a higher value than competing units.
10. The value of the accessories needs to be explained within the infomercial.
11. Consumers need reassurance that this is an easy unit to clean.
12. Convenience is a particularly important determinant for perceived value.
13. Consumers see this as a quality product as compared to competing units.
14. Alterations are needed to design and capabilities in order to sell to recent college graduates.
15. The taste of the food is very important and should be stressed.
16. The warranty should be given more than once during the infomercial to assure buyers the ease of return if a problem does occur.
17. Shipping costs will be a major factor in the decision making process.
18. We should market the product in the United States where a majority of college graduates reside.
19. Ronco Inc. may reach more customers if they expand their marketing beyond the infomercial and the Internet.
20. Coupons that have no value to the majority of viewers will negatively affect sales.
21. Showing how the product is cleaned would benefit in selling the product.
22. Emphasis should be placed on the fact that the product can handle any meal size.
From these twenty-two hypotheses, the final questionnaire was produced.
We are going to collect data through a survey to find out more about recent college graduates and their views on the rotisserie and their purchase intent. These surveys will be distributed throughout The Richard Stockton College campus with the assumption that these individuals will have similar purchasing intents to those individuals that recently graduated from college.
The sampling frame for this particular study is those attending The Richard Stockton College and the few individuals we can sample that attend other colleges and universities. Since we will not be able to obtain a list of those individuals that fit our study, we are going to try to get the people that we know, that are in our classes, that live with us or any other individuals that will give us the time to watch the video and then answer the accompanying survey.
We realize that in this study we will not being using the preferred sampling method due to the lack of financial resources available and the time restrictions we are faced with. In an ordinary study, we would use a probability study, the most common being a simple random sample. This type of sampling ensures better results, but unfortunately takes a lot of time. Due to the deadline of this project, a random sample would take much too long. Using that type sampling method, every element of the population is known and equally likely of being selected. If we had the time to do a probability sample, the best one to be conducted would be a simple random sample. There is a good chance that a cluster sampling method would have been done, due to the significant cost difference.
However, due to the nature of this study, we are using a nonprobability sampling method in which specific elements from the population have been selected in a nonrandom manner. The sampling error cannot be calculated and there is a good chance that bias will occur within the sample. The other major problem is that we cannot be sure that the sample is representative of the entire population and therefore should not be assumed for the entire population. We realize the disadvantages of this type of sampling method but we are able to deal with that due to lack of money, time and lack of access to all 6,000 names of Stockton students and/or other recent college students and graduates. Through careful collection, nonprobability samples can still be reasonably effective in this type of population.
In this pilot study there are a few nonprobability-sampling techniques that will be used. The convenient sample is used out of convenience. It is an efficient and effective way to acquire information, especially in exploratory situations where there is a need to get information in an economical way. This method will be used out of convenience due to the low cost and ease of obtaining people we know or that are in our other classes.
At the same time, there is a good chance that a snowball sample will also occur due to the fact that we will ask our friends to bring their friends and roommates to help us with our project. This method eliminates search costs, which is key in our study. We realize that there is a little more room for bias results using this method and that the sample may not be a good cross-section of the total population, but the results of this study will still be powerful.
Based on our selected population and sampling techniques, our sample size will depend on budget and time. We are going to get as many people as possible within the allotted amount of time to view the infomercial and share their insights through the survey. Mostly, our sample will come from people that we know. Our roommates, friends and peers are good places to start. We will invite these individuals to our apartments to watch the infomercial and then have them fill out the survey. We will also use friends and family members that are in the targeted age segment from home. These students do not attend The Richard Stockton College but are students in other institutions. One additional method we will use is to ask a professor to let the students in our class view the infomercial and then fill out the corresponding survey. This is a good method to obtain twenty to thirty individuals that are part of the study. Obtaining people on campus is a good method in making sure they are part of the intended population. Lastly, we will obtain people throughout out the halls, possibly in places like G-wing and ask them to come to an open classroom to view the infomercial and participate in the survey. The only previous arrangements needed would be to give the library a copy of the video and to find an empty classroom with VCR capabilities.
We also have to come up with a good sample size that fits our current resources. For determining sample size we had to find out how many recent college graduates there were in the United States. There are about 2.42 million college degrees earned in the United States as of the year 2000. This is the number we decided to use. (U.S. National Center for Education Statistics, 2000) In order to find this sample size and confidence interval we used a research tool on the Internet. The name of the site was www.surveysystems.com. We decided to use a confidence level of 95%. Our limited time and budget limits us to this confidence level. Before using this website we figured that we would only be able to get about 50 to 75 participants in the survey. This limits our confidence interval, but we have no choice for this study. At first we tried using a confidence interval of ten in the program. This gave us a sample size of 96, with exceeds our resources. With a confidence interval of twelve we got the sample size down to 67. This is a more realistic number for our purposes. Since we have such a small sample size we can't be sure that our results will reflect the entire population of recent college graduates. If we were to use a probability sample instead of a nonprobability sample, our sample size would be 37,816 with a confidence interval of 0.5. This would greatly increase the accuracy of our data, but is not realistic with our limited resources.
We will then administer our survey to the sample size. After this is done we must analyze the data. The first thing we must do upon receiving the questionnaires is validating the data. We must make sure that each questionnaire that was filled out is valid and not just a bunch of random answers. We must then code the data we receive. By coding we mean that we must assign numeric codes to the various responses of a particular question. For the open-ended questions we must group responses in different categories, then set numeric codes to each category. These questions take more time, but since we are dealing with a limited sample size they can be done.
After we receive the questionnaires back, we must determine what this information means. After the information is coded we will use excel to analyze the data. Through the statistical package we can use different formulas to test our hypotheses. We must choose the proper statistical test for each question asked in order to properly analyze the data. Some of the different tests we will be using are, the Z-test, ANOVA, Chi-square test, Kolmogorov-Smirnov test, and the T-test to name a few.
These different tests will be used for different questions to determine if our hypotheses are correct. The chi-square test is used to observe whether there is an observed pattern or to see if there is an expected pattern. Chi-square test can be used for a single sample, or two independent samples depending on what kind of information you need analyzed. The Chi-square test is effective in determining differences in gender.
The Kolmogorov-Smirnov test is similar to Chi-Square. This test is used when you are trying to see if there is a degree of agreement between the distribution of an observed value, and some expected distribution. This is an appropriate test when dealing with ordinal data.
The Z-test is used when testing a single mean for a hypothesis. This can only be done though when the sample is large enough and is drawn from a normal population.
Since the Z-test requires a large enough sample we will most likely not use this test. Instead we will use the t-test. It is the same kind of test except it doesn't require a large sample.
Analysis of variance, (ANOVA) is used when the goal is to test the differences among the means of two or more independent samples. It is most commonly used for hypothesis tests. This test permits us to determine whether the variability among or across the sample. If the mean is greater than expected this is due to a sampling error.
For the Showtime Rotisserie and Grill, our main interest right now is recent college graduates. As defined by the client, we are interested in those young adults within the ages of 18 to 30 who recently graduated from college and are entering the job market or those that just recently entered the work force. We are concerned with those individuals that are setting up their own places to live and those that plan to do so shortly.
At first we formed a focus group in order to see what a small amount of college graduates thought about the infomercial and the product itself. Through their insights, we were able to form hypotheses that helped us to create the questionnaire that will be used in this project. We are extremely interested in whether the male and female differences picked up in the focus group will remain throughout the study. After each team formed questionnaires, they were analyzed until one new one was created. Everyone then picked that apart, until the final survey could be formed which is what is going to be used in this study.
The hypotheses that were used to create the questionnaires were first formed by four individual teams. Later all the teams collaborated in order to form one joint set of hypotheses. What first started out at about 70 different hypotheses was narrowed down to twenty-four. The following are the twenty-two hypotheses decided upon by the whole.
1. A convincing audience within the infomercial will be one that is made up of a majority of the target audience.
2. All prices of accessories should be given in the infomercial to aid in the decision making process.
3. Infomercial hosts should be closer in age to the target market.
4. The number of testimonials should be reduced.
5. It would increase the credibility of the testimonials is a disclaimer was shown to verify that the people giving the testimonials were not being paid.
6. Consumers are concerned with hidden costs not explained within the infomercial.
7. It would aid in the purchasing decision if consumers better understood the value that they were receiving for their money.
8. Consumers will use this product at least twice per month.
9. The rotisserie is seen as having a higher value than competing units.
10. The value of the accessories needs to be explained within the infomercial.
11. Consumers need reassurance that this is an easy unit to clean.
12. Convenience is a particularly important determinant for perceived value.
13. Consumers see this as a quality product as compared to competing units.
14. Alterations are needed to design and capabilities in order to sell to recent college graduates.
15. The taste of the food is very important and should be stressed.
16. The warranty should be given more than once during the infomercial to assure buyers the ease of return if a problem does occur.
17. Shipping costs will be a major factor in the decision making process.
18. We should market the product in the United States where a majority of college graduates reside.
19. Ronco Inc. may reach more customers if they expand their marketing beyond the infomercial and the Internet.
20. Coupons that have no value to the majority of viewers will negatively affect sales.
21. Showing how the product is cleaned would benefit in selling the product.
22. Emphasis should be placed on the fact that the product can handle any meal size.
From these twenty-two hypotheses, the final questionnaire was produced.
We are going to collect data through a survey to find out more about recent college graduates and their views on the rotisserie and their purchase intent. These surveys will be distributed throughout The Richard Stockton College campus with the assumption that these individuals will have similar purchasing intents to those individuals that recently graduated from college.
The sampling frame for this particular study is those attending The Richard Stockton College and the few individuals we can sample that attend other colleges and universities. Since we will not be able to obtain a list of those individuals that fit our study, we are going to try to get the people that we know, that are in our classes, that live with us or any other individuals that will give us the time to watch the video and then answer the accompanying survey.
We realize that in this study we will not being using the preferred sampling method due to the lack of financial resources available and the time restrictions we are faced with. In an ordinary study, we would use a probability study, the most common being a simple random sample. This type of sampling ensures better results, but unfortunately takes a lot of time. Due to the deadline of this project, a random sample would take much too long. Using that type sampling method, every element of the population is known and equally likely of being selected. If we had the time to do a probability sample, the best one to be conducted would be a simple random sample. There is a good chance that a cluster sampling method would have been done, due to the significant cost difference.
However, due to the nature of this study, we are using a nonprobability sampling method in which specific elements from the population have been selected in a nonrandom manner. The sampling error cannot be calculated and there is a good chance that bias will occur within the sample. The other major problem is that we cannot be sure that the sample is representative of the entire population and therefore should not be assumed for the entire population. We realize the disadvantages of this type of sampling method but we are able to deal with that due to lack of money, time and lack of access to all 6,000 names of Stockton students and/or other recent college students and graduates. Through careful collection, nonprobability samples can still be reasonably effective in this type of population.
In this pilot study there are a few nonprobability-sampling techniques that will be used. The convenient sample is used out of convenience. It is an efficient and effective way to acquire information, especially in exploratory situations where there is a need to get information in an economical way. This method will be used out of convenience due to the low cost and ease of obtaining people we know or that are in our other classes.
At the same time, there is a good chance that a snowball sample will also occur due to the fact that we will ask our friends to bring their friends and roommates to help us with our project. This method eliminates search costs, which is key in our study. We realize that there is a little more room for bias results using this method and that the sample may not be a good cross-section of the total population, but the results of this study will still be powerful.
Based on our selected population and sampling techniques, our sample size will depend on budget and time. We are going to get as many people as possible within the allotted amount of time to view the infomercial and share their insights through the survey. Mostly, our sample will come from people that we know. Our roommates, friends and peers are good places to start. We will invite these individuals to our apartments to watch the infomercial and then have them fill out the survey. We will also use friends and family members that are in the targeted age segment from home. These students do not attend The Richard Stockton College but are students in other institutions. One additional method we will use is to ask a professor to let the students in our class view the infomercial and then fill out the corresponding survey. This is a good method to obtain twenty to thirty individuals that are part of the study. Obtaining people on campus is a good method in making sure they are part of the intended population. Lastly, we will obtain people throughout out the halls, possibly in places like G-wing and ask them to come to an open classroom to view the infomercial and participate in the survey. The only previous arrangements needed would be to give the library a copy of the video and to find an empty classroom with VCR capabilities.
We also have to come up with a good sample size that fits our current resources. For determining sample size we had to find out how many recent college graduates there were in the United States. There are about 2.42 million college degrees earned in the United States as of the year 2000. This is the number we decided to use. (U.S. National Center for Education Statistics, 2000) In order to find this sample size and confidence interval we used a research tool on the Internet. The name of the site was www.surveysystems.com. We decided to use a confidence level of 95%. Our limited time and budget limits us to this confidence level. Before using this website we figured that we would only be able to get about 50 to 75 participants in the survey. This limits our confidence interval, but we have no choice for this study. At first we tried using a confidence interval of ten in the program. This gave us a sample size of 96, with exceeds our resources. With a confidence interval of twelve we got the sample size down to 67. This is a more realistic number for our purposes. Since we have such a small sample size we can't be sure that our results will reflect the entire population of recent college graduates. If we were to use a probability sample instead of a nonprobability sample, our sample size would be 37,816 with a confidence interval of 0.5. This would greatly increase the accuracy of our data, but is not realistic with our limited resources.
We will then administer our survey to the sample size. After this is done we must analyze the data. The first thing we must do upon receiving the questionnaires is validating the data. We must make sure that each questionnaire that was filled out is valid and not just a bunch of random answers. We must then code the data we receive. By coding we mean that we must assign numeric codes to the various responses of a particular question. For the open-ended questions we must group responses in different categories, then set numeric codes to each category. These questions take more time, but since we are dealing with a limited sample size they can be done.
After we receive the questionnaires back, we must determine what this information means. After the information is coded we will use excel to analyze the data. Through the statistical package we can use different formulas to test our hypotheses. We must choose the proper statistical test for each question asked in order to properly analyze the data. Some of the different tests we will be using are, the Z-test, ANOVA, Chi-square test, Kolmogorov-Smirnov test, and the T-test to name a few.
These different tests will be used for different questions to determine if our hypotheses are correct. The chi-square test is used to observe whether there is an observed pattern or to see if there is an expected pattern. Chi-square test can be used for a single sample, or two independent samples depending on what kind of information you need analyzed. The Chi-square test is effective in determining differences in gender.
The Kolmogorov-Smirnov test is similar to Chi-Square. This test is used when you are trying to see if there is a degree of agreement between the distribution of an observed value, and some expected distribution. This is an appropriate test when dealing with ordinal data.
The Z-test is used when testing a single mean for a hypothesis. This can only be done though when the sample is large enough and is drawn from a normal population.
Since the Z-test requires a large enough sample we will most likely not use this test. Instead we will use the t-test. It is the same kind of test except it doesn't require a large sample.
Analysis of variance, (ANOVA) is used when the goal is to test the differences among the means of two or more independent samples. It is most commonly used for hypothesis tests. This test permits us to determine whether the variability among or across the sample. If the mean is greater than expected this is due to a sampling error.