I.OVERVIEW OF SIEMENS GROUP AND ITS R&D FUNCTION11.Overview12.Financials23.R&D functions3II.SUMMARY OF SIEMENS' CORE COMPETENCIES6III.TECHNOLOGY MANAGEMENT AT SIEMENS - ANALYSIS BASED ON RELEVANT THEORIES AND MODELS81."Stay a jump ahead" strategy (S-curve model)82."Learning together" (Open market innovation theory)103.Integrated technology management124."Pictures of the Future" (An extended version of technology roadmap)145.Technology identification and assessment process166.Non-linear innovation process (Kline model)187.Current and prospective innovation rate198.3i Program (Funnel model for idea generation)209.Customer connection (Chasm theory)2210.New combinations (Schumpeter model)2311.Tolerance for doubt and failure24IV.CURRENT ISSUES AND RECOMMENDATIONS251.Innovator's dilemma (mobile phone business case)252.Possible negative impacts from M&A on technological synergy263.Harder management on commercial value maximization28APPENDIX30BIBLIOGRAPHY31I - OVERVIEW OF SIEMENS GROUP AND ITS R&D FUNCTION1. OVERVIEWSiemens ("the Group") was founded in 1847 under the name Siemens & Halske Telegraph Construction Company. The Group's first product was pointer telegraph and now, after 159 years of history, it has become a giant diversified leader in the electric engineering sector, headquartered in Germany with business activities in 190 countries and 290 manufacturing facilities worldwide.
 ASO!Group Gift coming soon!
 English: Siemens S65 mobile phone Deutsch: Mobilte...
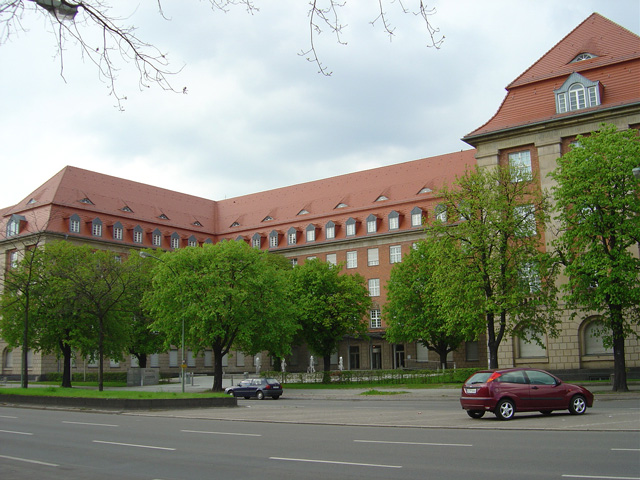 The Berlin headquarters of the Siemens Group, Siem...
The Group's business areas are broken down into 6 main categories as bellow:Automation and Control;Information and Communications;Transportation;Medical ;Services (business, energy, financial, industrial, training); andPower.
Table 1 - Siemens' operating principles since April 2005(source: Siemens' Annual Report 2006)2. FINANCIALSSummary of major financial indicators are presented in the following charts. For information of revenue and profit by business division over the period from 2003 to 2006, please refer to the Appendix.
Table 2 - Revenue and Profit by year (source: Siemens' Annual Report 2004 and 2006))Table 3 - Revenue by geographical area (source: Siemens' Annual Report 2004 and 2006)3. R&D FUNCTION3.1. R&D expenditureTable 4 - R&D expenditure by business division in 2005 (source: Siemens' website)As a trend analysis, in recent years, the relative percentage of R&D invested in Information and...