TABLE OF CONTENTS
Sr.No. Topic Page Nos.
1. Introduction 1
2. What is Six Sigma? 2
3. Why Six Sigma? 3
4. Implementation of Six Sigma 4-6
5. Companies using Six Sigma Their cost and savings 7
6. Performance Levels from 1 Sigma to 6 Sigma 8
7. Conclusion 9
8. References 10
LIST OF TABLES AND
FIGURES
1) NORMAL DISTRIBUTION CURVES
2) SIX SIGMA PERFORMANCE LEVELS
3) ORGANISATIONAL SETUP
4) COST & SAVINGS OF COMPANIES
USING SIX SIGMA
5) YIELD AND SIGMA LEVELS
INTRODUCTION
In this day and age of intense competition, quality has to be a prerequisite; not an afterthought. Also, this quality should not only be in the products coming out of the factory but also in delivery, processing of orders and in taking down orders. Even fields like marketing, sales and advertising have to become more efficient. As Taguchi, the Japanese pioneer in the field of quality control said," Quality is the sum total of the losses incurred by the society due to a defective product, improper delivery & wrong order processing."
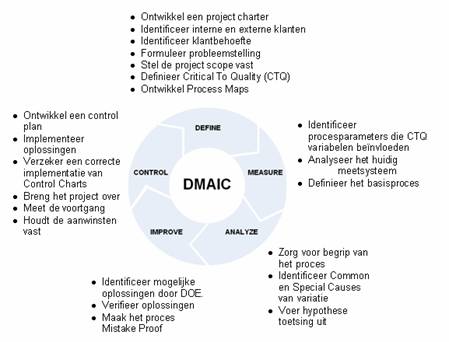 dmaic
dmaic Six Sigma Green Belt - New Delhi - Dec 3, 4 and 5 ...
 Six sigma
To take care of this the concept of quality control was developed. Companies have been practicing this for quite a few years now. Various management theories and standards have also come up to deal with this. The most popular of these are ISO and TQM (Total Quality Management). The problem with these are that although they looked good in theory, could not deliver as per their promises. Due to their shortcomings a new concept was developed by Motorola engineer Bill Smith in 1986 ,and which has become a mantra in management circles today: SIX SIGMA.
1
WHAT IS SIX SIGMA?
Simply speaking, Six sigma is the measure of the standard deviation of a process from a mean or expected value. Carl Frederick Gauss...
Great detail.
This essay provides a great explanation for a topic that is difficult to understand for some. The cost and savings section really shows reasons for this type of standard of quality.
4 out of 4 people found this comment useful.