Investing is tricky and deciding what to invest in requires careful though and research as to how a business is executing. The purpose of this research is to decide weather to invest in Coca-Cola or Pepsi. In deciding, we will examine how the two companies are managed from the perspectives of Profitability, Asset Utilization, Risk Management, and Cash Flow.
Profitability
Profitability is defined as a company's ability to generate net income per dollar of Sales (Albrecht, Stice, Stice, & Swain, 2005, p. 215). In determining if a business is profitable several factors are weighed. A financial statements analysis examining Pepsi and Coca-Cola Year over Year performance in Gross Margin on Sales and Price Earning Ratios documents the following:
The first ratio we will use to determine a company's gross profit is the gross margin on sales ratio. The result represents the amount of money the company generated over the cost of producing its goods and services.
 Pepsi
Pepsi Coca-Cola
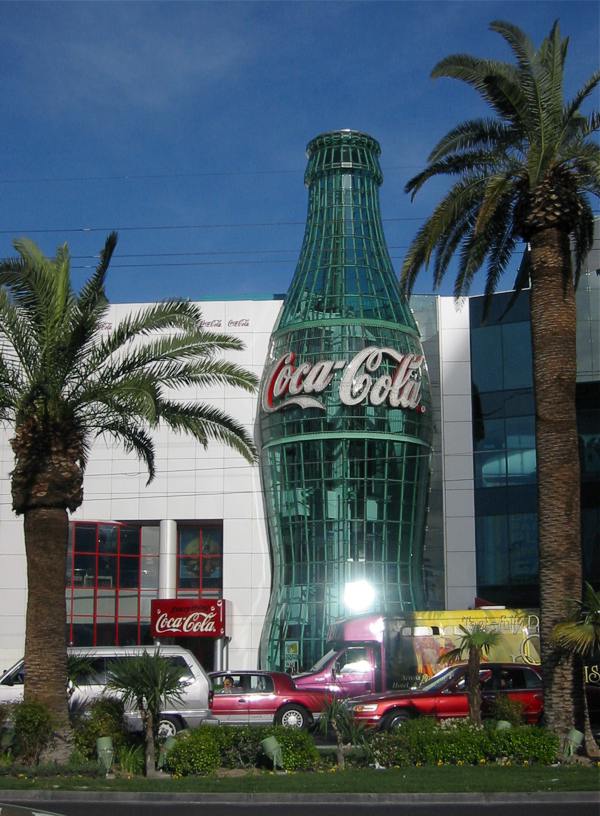 The Las Vegas Strip World of Coca-Cola museum in 2...
Gross profit is measured by subtracting a company's total sales revenue from its cost of sales then dividing by the total sales (Investopedia, n.d.). Coca-Cola - 2001 thru 2005 recorded an increase of 0.3% Gross Margin on Sales, while Pepsi recorded a 2.2% increase over the same period of time. Coca-Cola (Coca-Cola Enterprises Inc., 2006 & PepsiCo Inc., 2005). Refer to Figure 1
The second profitability ratio we will use is the price earning (P/E) ratio. P/E ratios show a company's per share price compared to it's per share earnings. This ratio is demonstrated by dividing the common stock value by the earning per share (EPS) (Investopedia, n.d.). Coca-Cola's P/E decreased by 18.67 from the time period, 2001 - 2005, while Pepsi P/E decreased 12.16, over the same period of time (Coca-Cola Enterprises Inc., 2006 & PepsiCo Inc., 2005). Refer...