Charts and graph are images that present data symbolically. They are used to present information and numerical data in a simple, compact format. This paper will focus on three types of charts and/or graphs which are: pie charts, bar graphs, and histograms.
What types of data there are and how the data was collected is important for the reader to understand.. According to Bennett, Briggs, and Triola (2003) there are two types of data. They are:
*Qualitative data- Data consisting of values that describe qualities or nonnumeric categories.
*Quantitative data- Data consisting of values representing counts or measurements (p G-4).
In the following three examples of charts/graphs the type of data being displayed will be discussed.
Pie Chart
Excellent use of section headings!
The first type to be discussed is a pie chart. A pie chart is "a circle divided so that each wedge represents the relative frequency of a particular category.
 The Village People - Cop
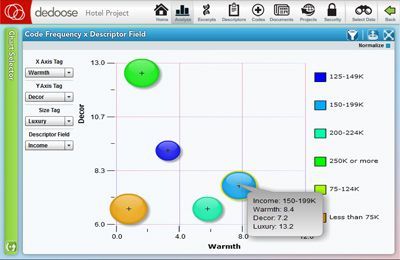 English: Interactive Visualization of Qualitative ...
 English: Screenshot of Dedoose Interactive Visuali...
The wedge size is proportional to the relative frequency, and the entire pie represents the total relative frequency of 100%" (Bennett et al., 2003, p G-3).
This first chart displays the results of a 60-day survey to determine the amount of library users conducting searches within the nursing profession (Jones, 2006, p 1). Excellent citations throughout your paper. In this study qualitative data was analyzed to determine and measure user activity. The qualitative data was gathered using random sampling. A survey tool was developed to interactively collect information from library users.
Example 1
Note: Virginia Henderson International Nursing Library: A work in progress, 2006, retrieved from
http://www.nursingsociety.org/RNL/Current/in_touch/library.html
Excellent chart!
Bar Graph
The second example of a graph is the bar graph. A bar graph is "a diagram consisting of bars representing the frequencies (or relative frequencies) for particular categories. The bar lengths are proportional to the...