As I researched in Realtor.com's website I came up with these prices for 3 bedroom, 2 bath homes in these different cities in the chart and graph below. The most expensive place to live is in San Francisco, CA and the least expensive is Dallas, TX. The only logical explanation I could come up with of why prices across our nation vary so much from city to city is that you pay for what you want. If you want to live by the coast and enjoy beautiful weather 90% of the year, rather than live in another area and have good weather 40% to 60% of the year you will pay for it.
Other reasons why prices in areas are higher than others are taxes, some states, counties and cities have higher taxes and that could make the price of the house whatever price it is be more expensive for the taxes you will have to pay year after year.
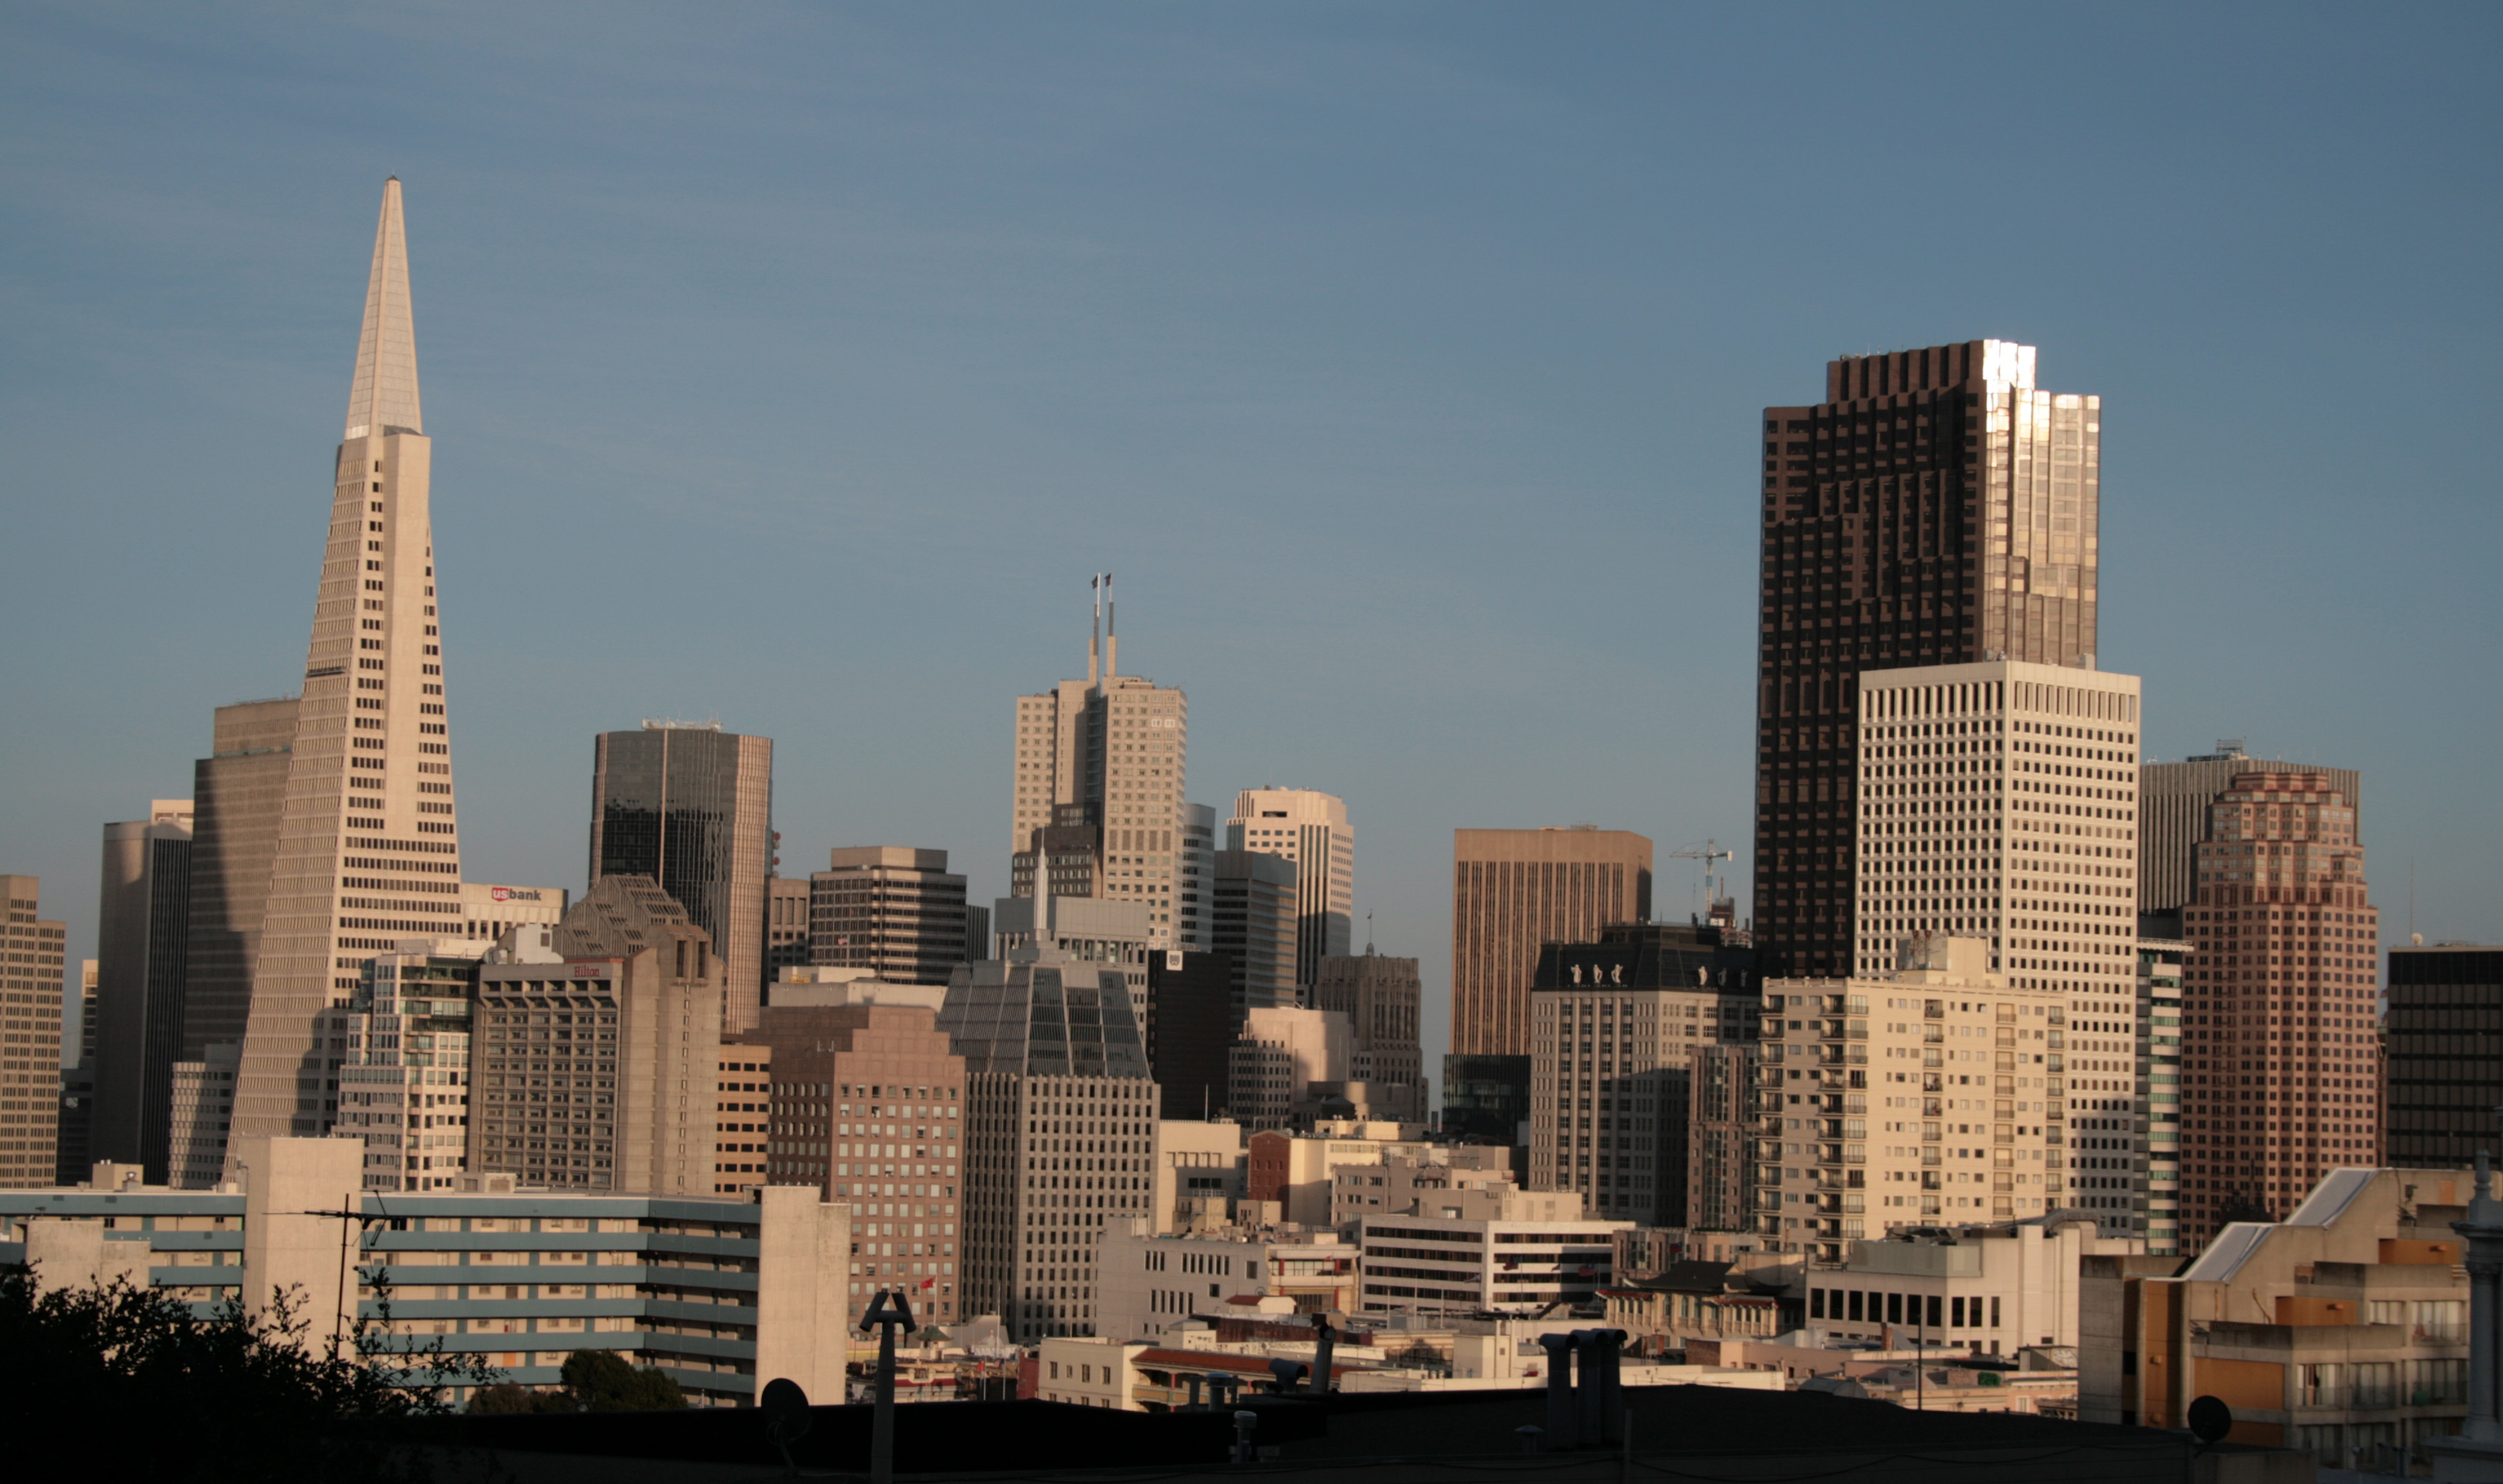 English: North Financial District, San Francisco, ...
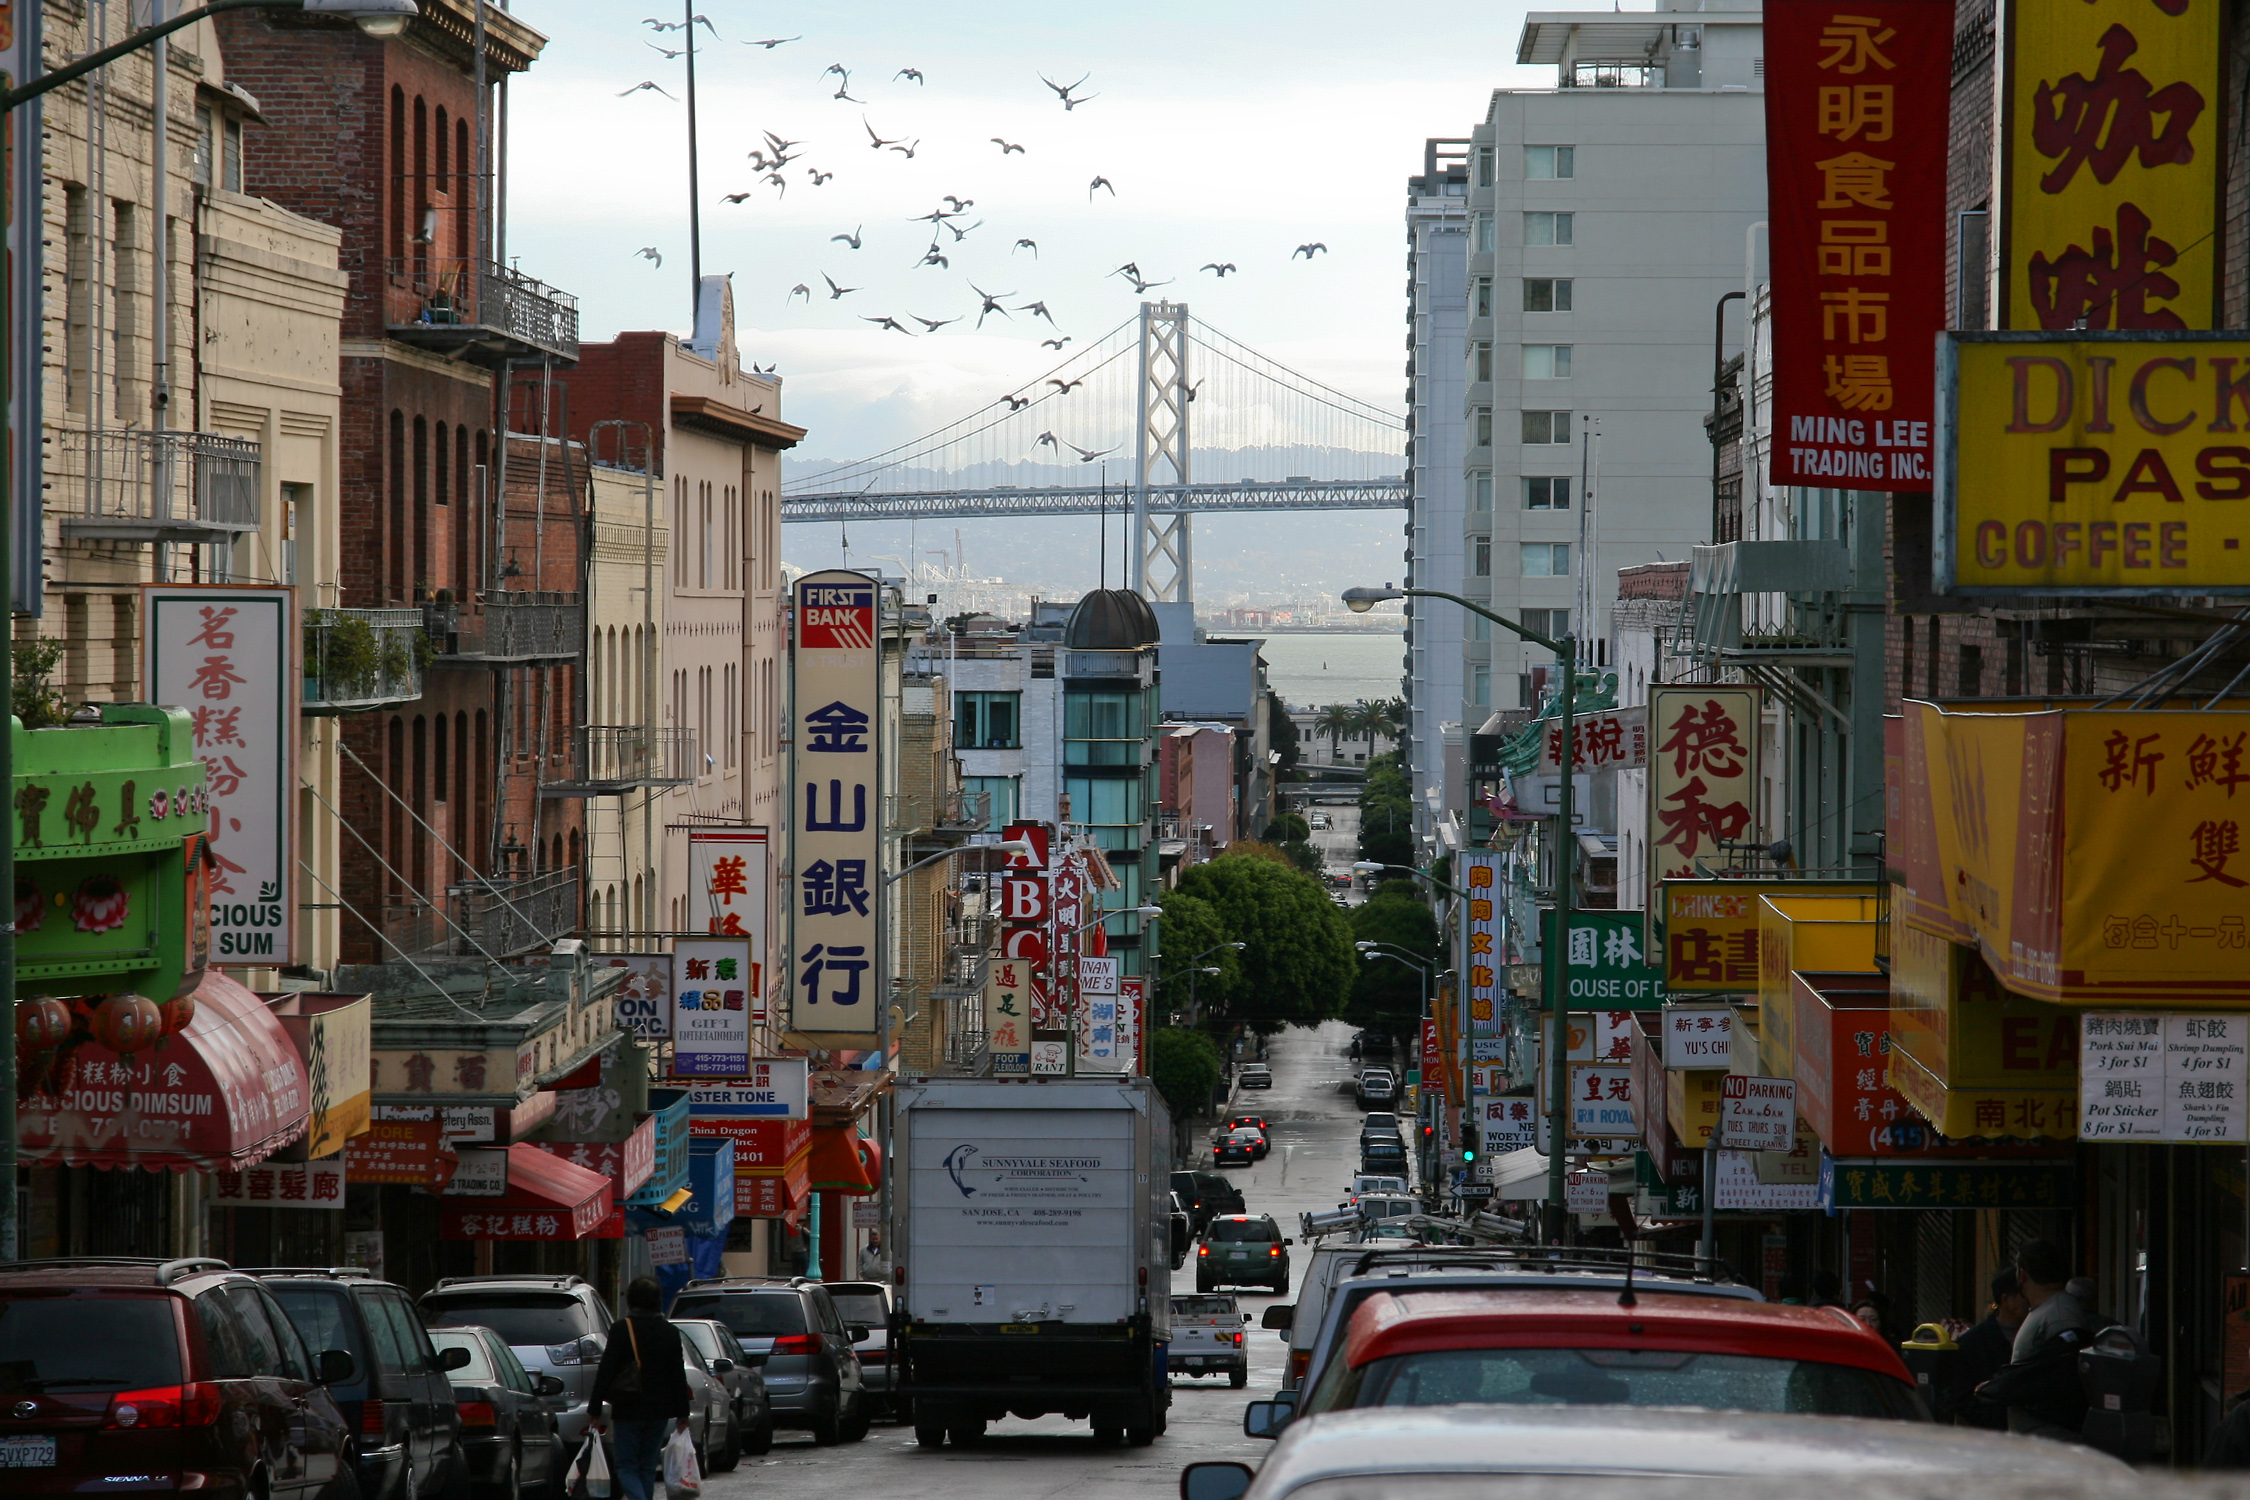 English: China Town in San Francisco, CA. In the b...
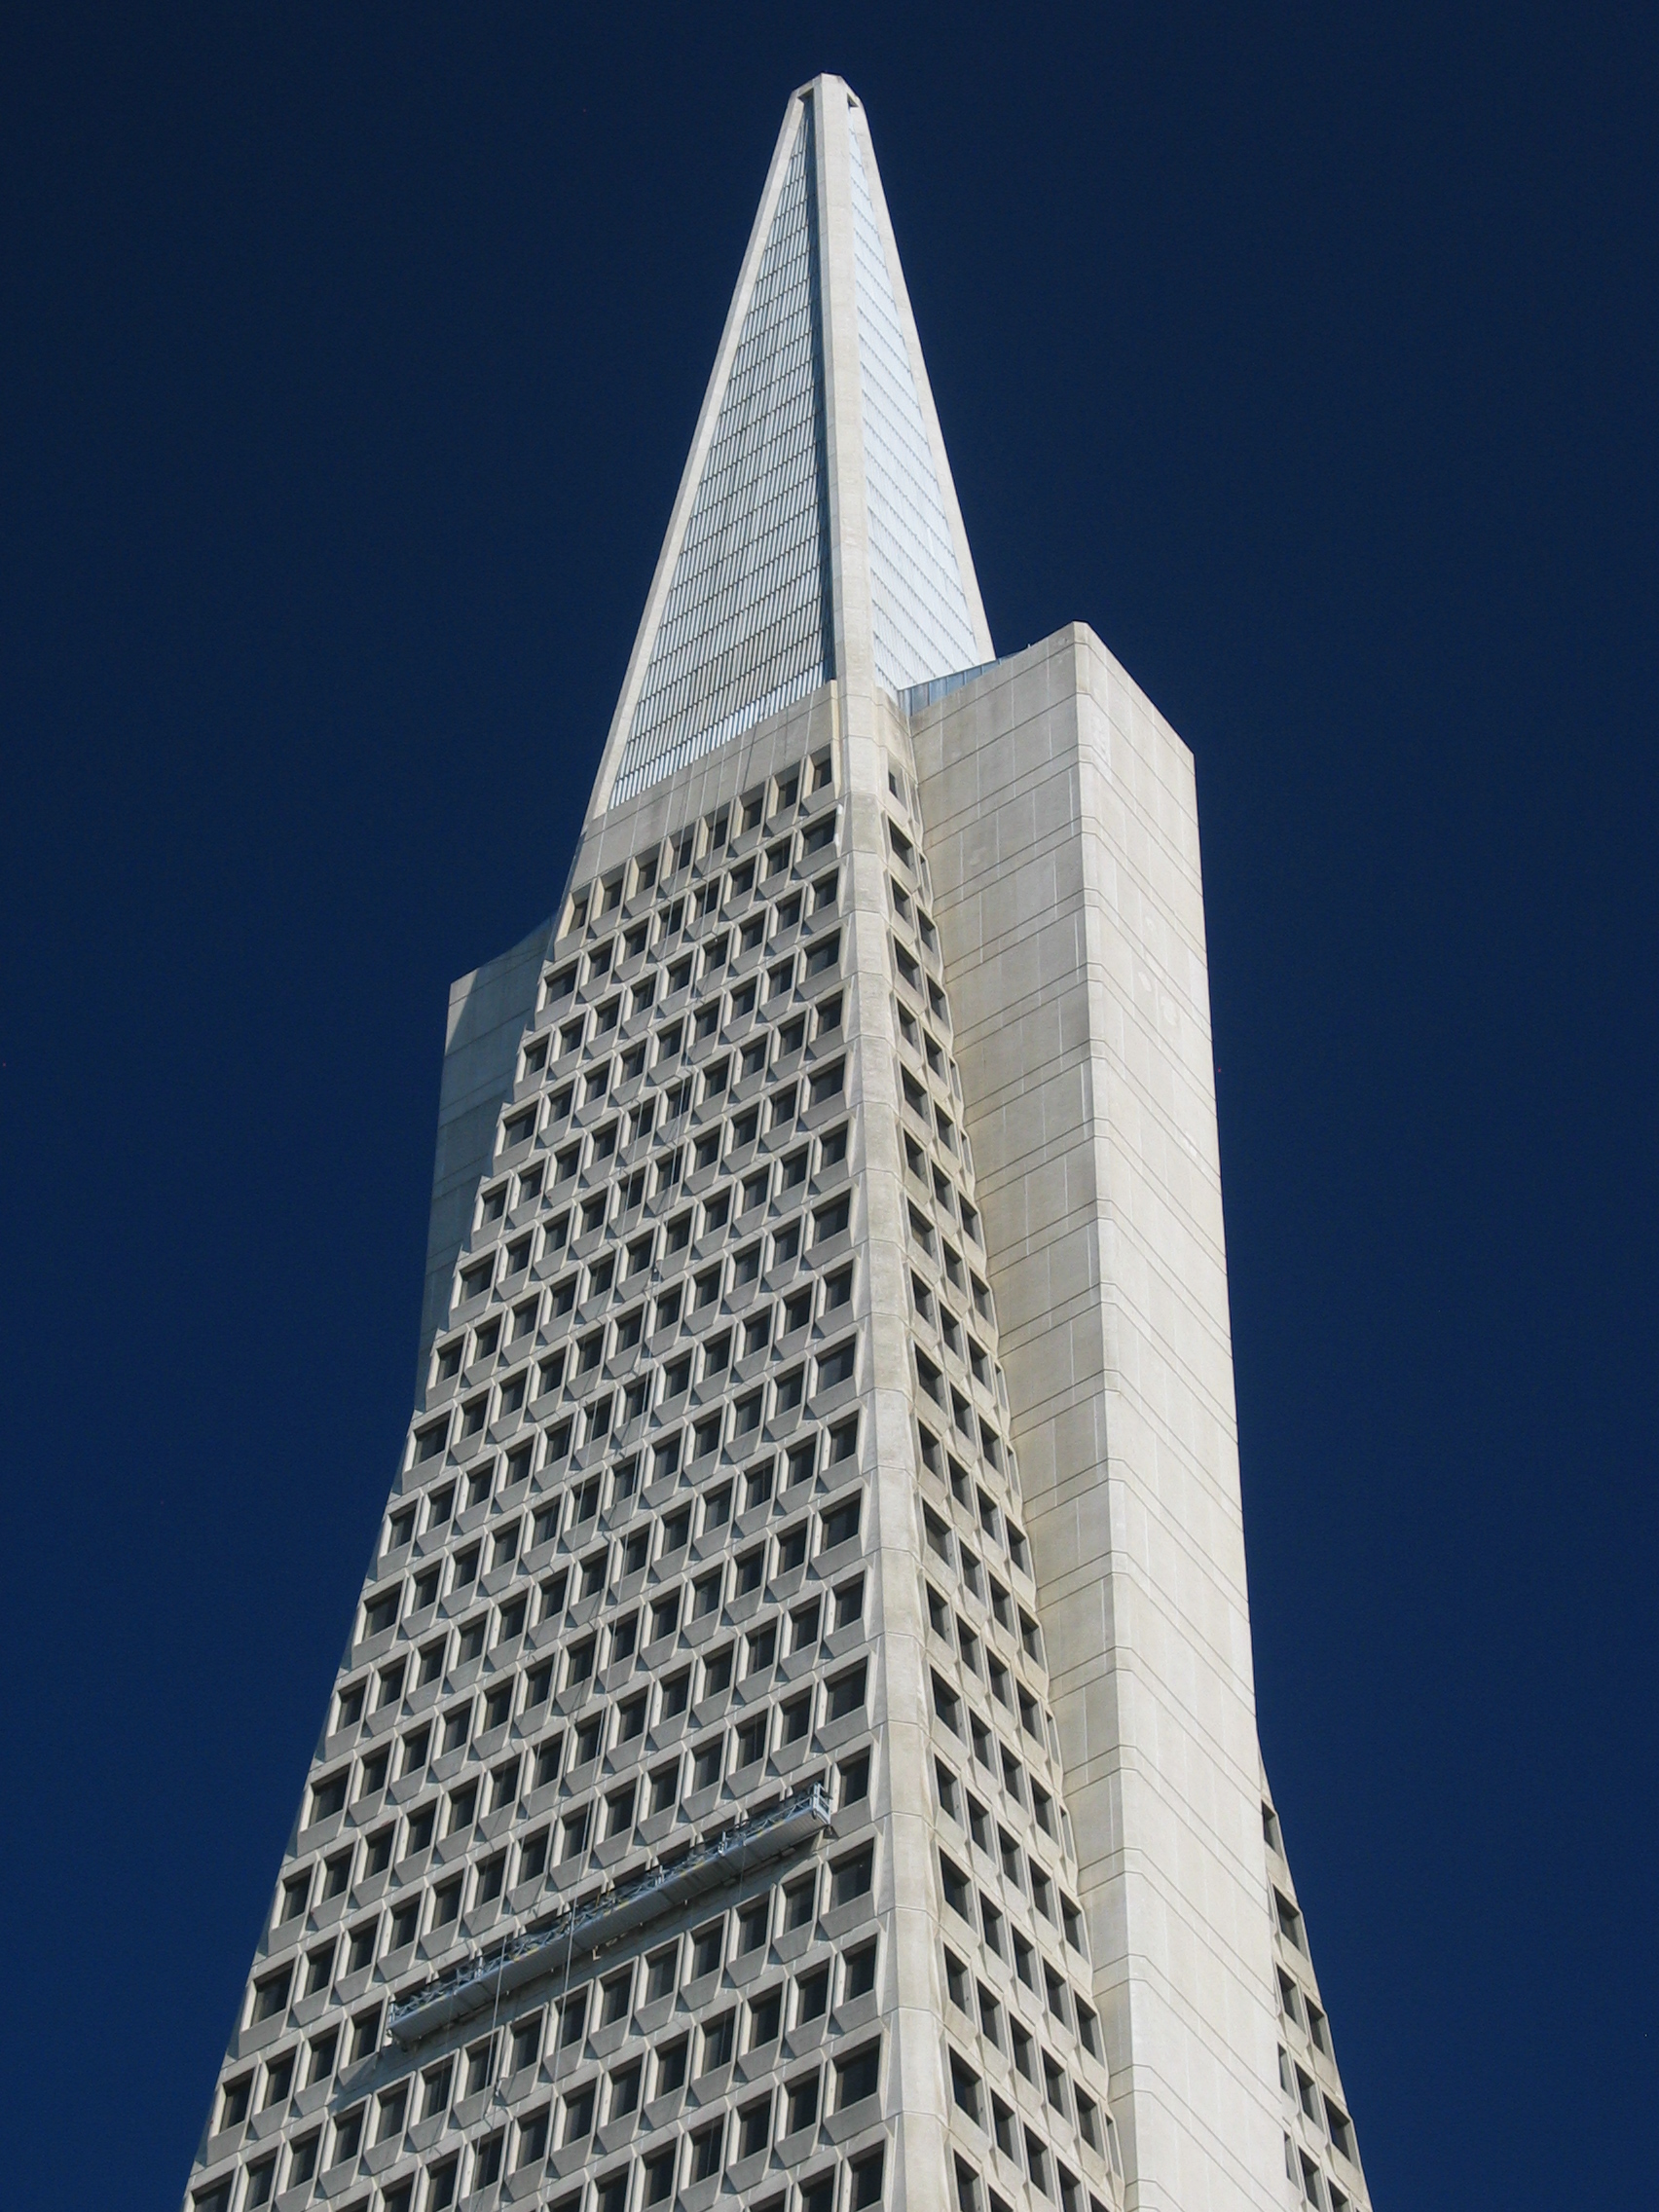 Top of the Transamerica building, downtown San Fra...
The environment surrounding your neighborhood could also affect the cost of the home. If there is a good school district, a college, a well known shopping mall all these are contributing factors to the price of a home.
Prices also trend to rise and fall due to the amount of houses on inventory for sale and how long they have been on the market for. For example, in CA a year ago, there was a 2.8 months supply of unsold inventory and this year it is tracking at 5.9 month supply. (Realtor.com, 2006) From 3 months to 6 months that means people's houses that are for sale are on the market longer than last year and that could mean that sellers may cut prices in order to sell their home.
If there is a shortage (Excess Demand) consumers will...
Good job
I never knew San Fransisco was so expensive I found that very interesting.
0 out of 0 people found this comment useful.