The article I evaluated was located on the web @ http://www.cdc.gov/mmwr/preview/mmwrhtml/00049427.htm This article was presented by the CDC to help inform and update the general public about the effect and trends of world-wide diseases. The reports are used to report the total number of cases; percentage of population vaccinated and includes the number of deaths caused by the listed disease. This article is reporting the number of measles cases each year world-wide from measles. Upon closer inspection of the data reported, I realized that the death rate estimated for each year was actually greater than the actual numbers of cases reported. I wondered if they had two different case reports, one that was used for fatal cases and a separate report for cases that were not fatal. (If so they need to state this information on the chart or referenced somewhere) As I read the rest of the article I did not find any explanation of how the data was gathered or grouped together.
 Crude death rate by country
 English: The Centers for Disease Control and Preve...
 None - This image is in the public domain and thus...
Upon completion of the article, I noticed the graph used with the report shows approximately 750,000 cases of measles reported worldwide. This caught my attention because in the beginning of the article it stated approximately 1 million children die from measles each year. The purpose of charts and graphs is to clarify the information it is used with, not to make it more confusing. I realize the death total is an estimation, but why would it be greater than the figure of total cases? What does all this say about how much we can trust CDC and other statistics, including the care with which they are gathered and the accuracy with which they are reported?
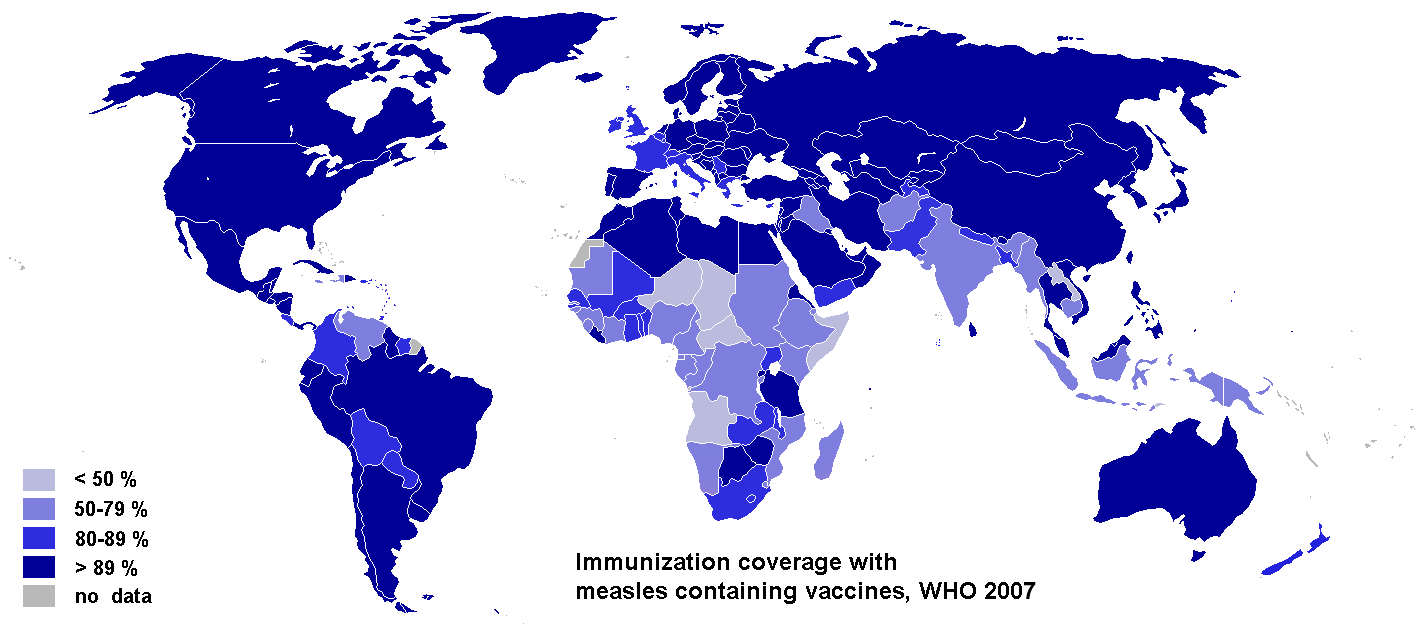 English: Immunization coverage with measles contai...
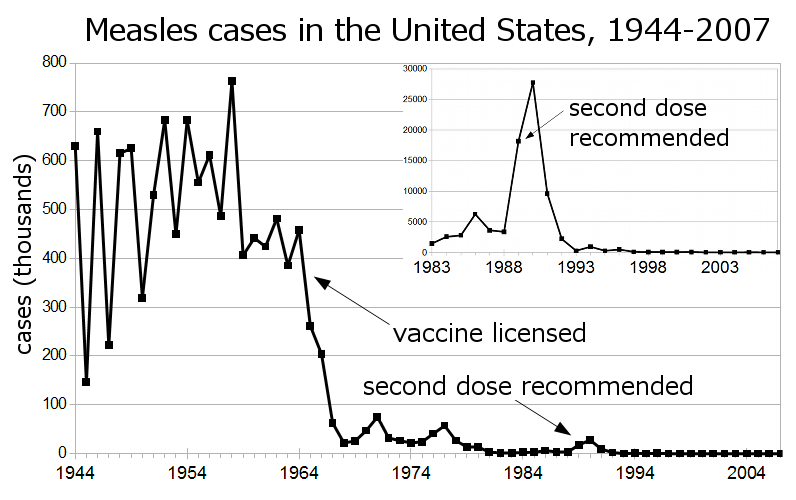 Measles cases reported in the United States before...
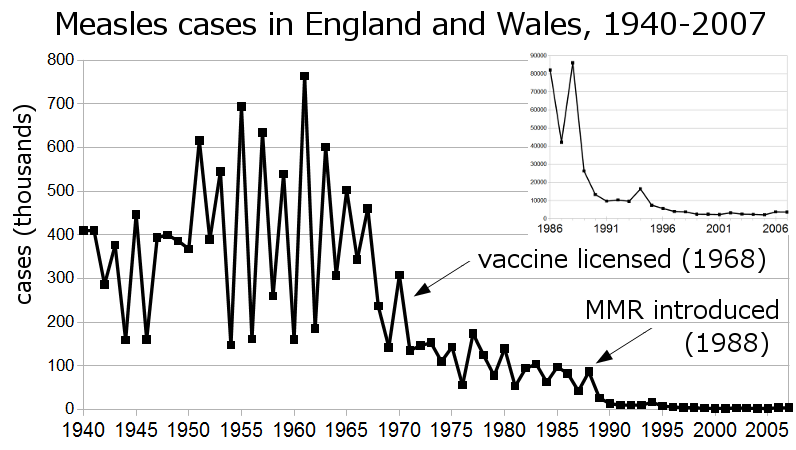 Reported cases of measles in England and Wales fro...