1.Present a table of class data, showing the average titration in ml and amount of Vitamin C. in mg/ml.
Class averages Of Ascorbic Acid.
2.Compare and contrast the results you obtained for part A. Which drink contained the most/ least ascorbic acid? What were the % differences? (Can you present these graphically? e.g. histogram, pie chart etc. How do the amounts relate to figures claimed on any packaging?) Comment on your results.
The drinks that contained the least Ascorbic Acid were the orange squash and the Standard Solution.
Pie Chart representing class results of Ascorbic Acid mg/ml.
The Orange juice contained 40mg/100ml of Vitamin C, which was 0.084mg/100ml more than was stated on the packaging.
The Orange Squash had 1mg/100ml of Vitamin C, there was no Vitamin C stated on the packaging.
The ready to drink juice contained 30mg/100ml of Vitamin C, which was 0.24mg/100ml
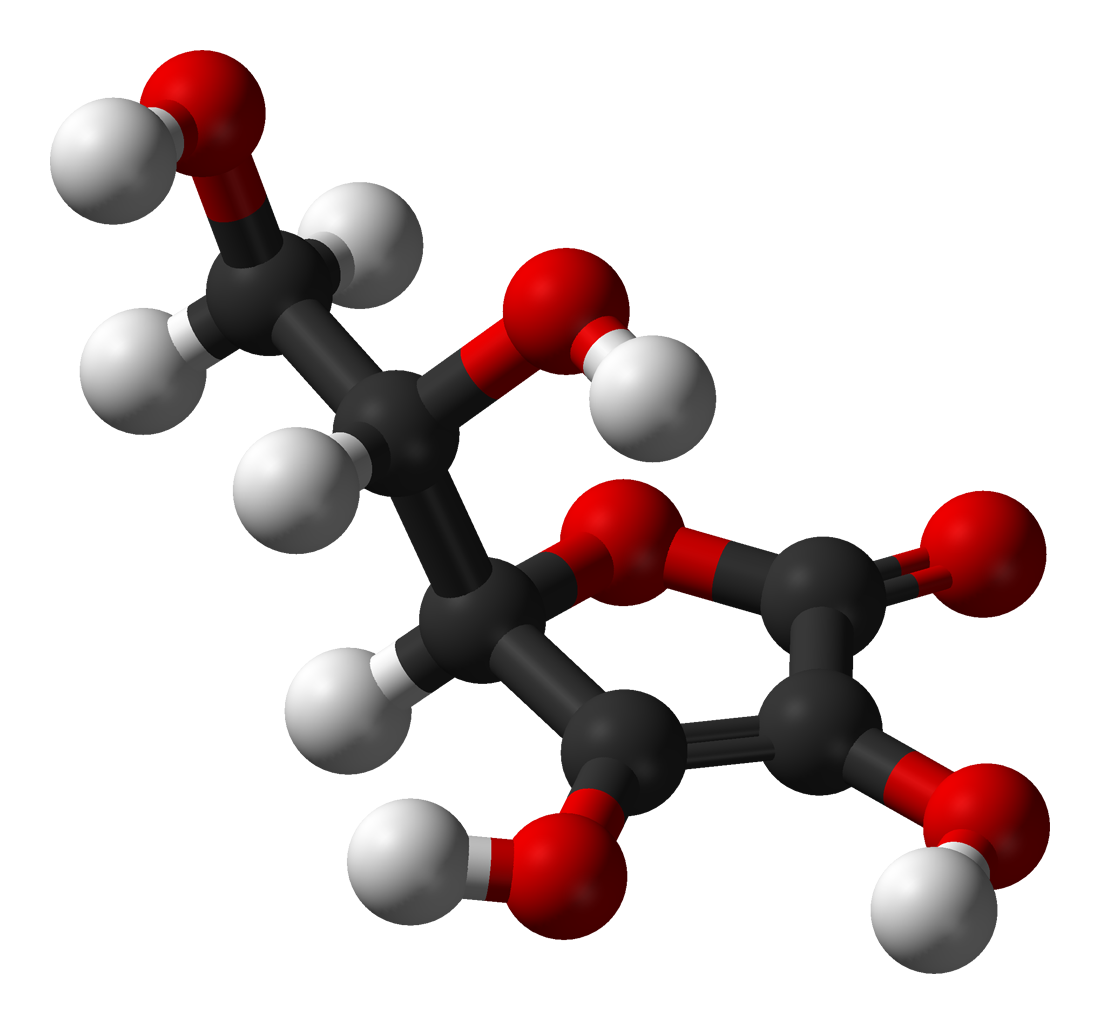 The structure of the antioxidant vitamin ascorbic ...
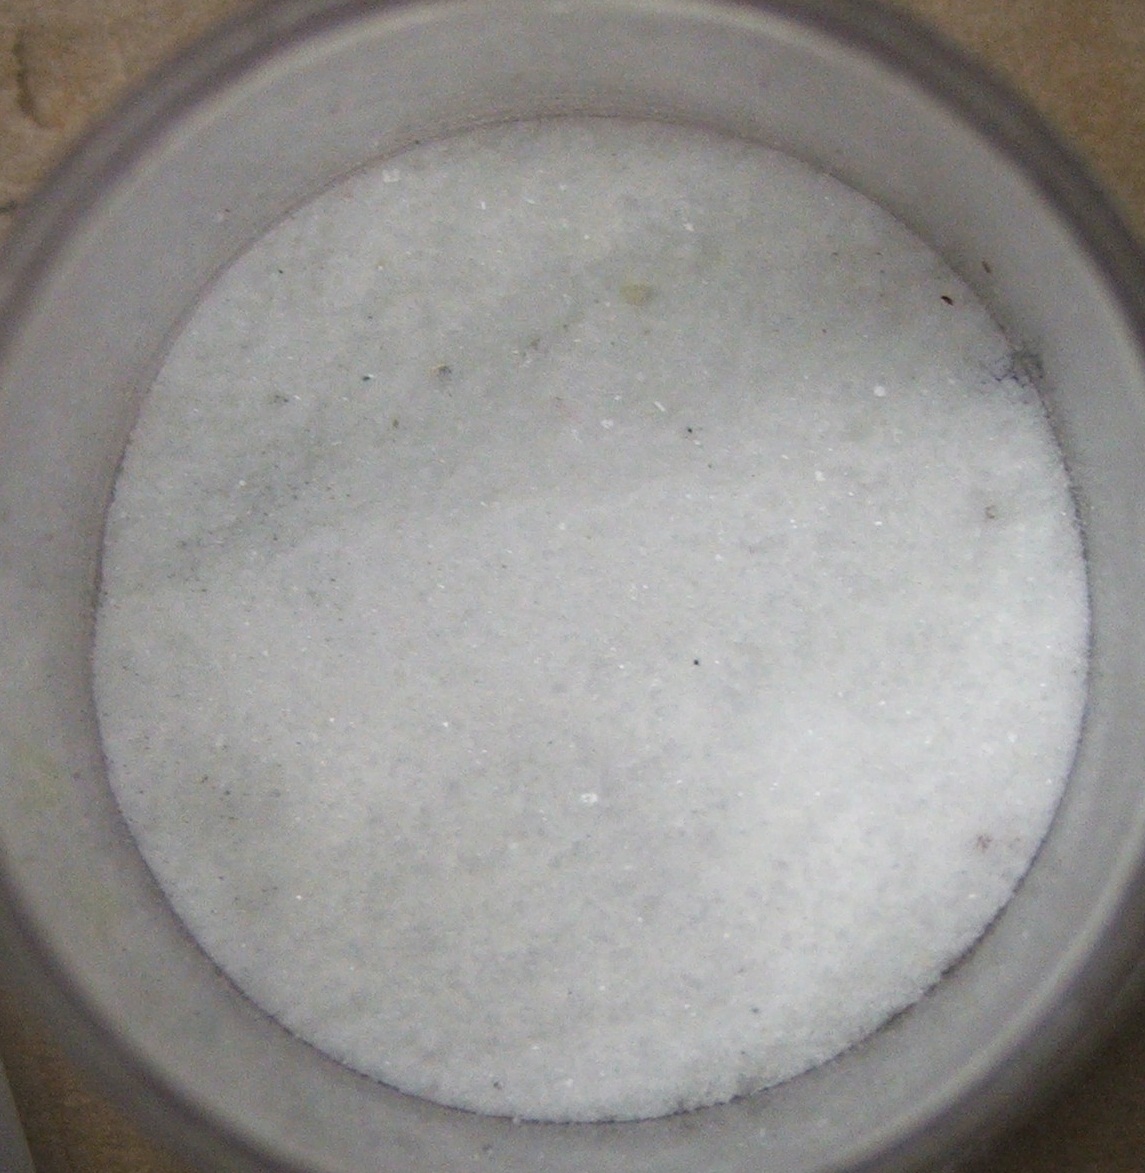 English: Ascorbic acid from vitamin supplement
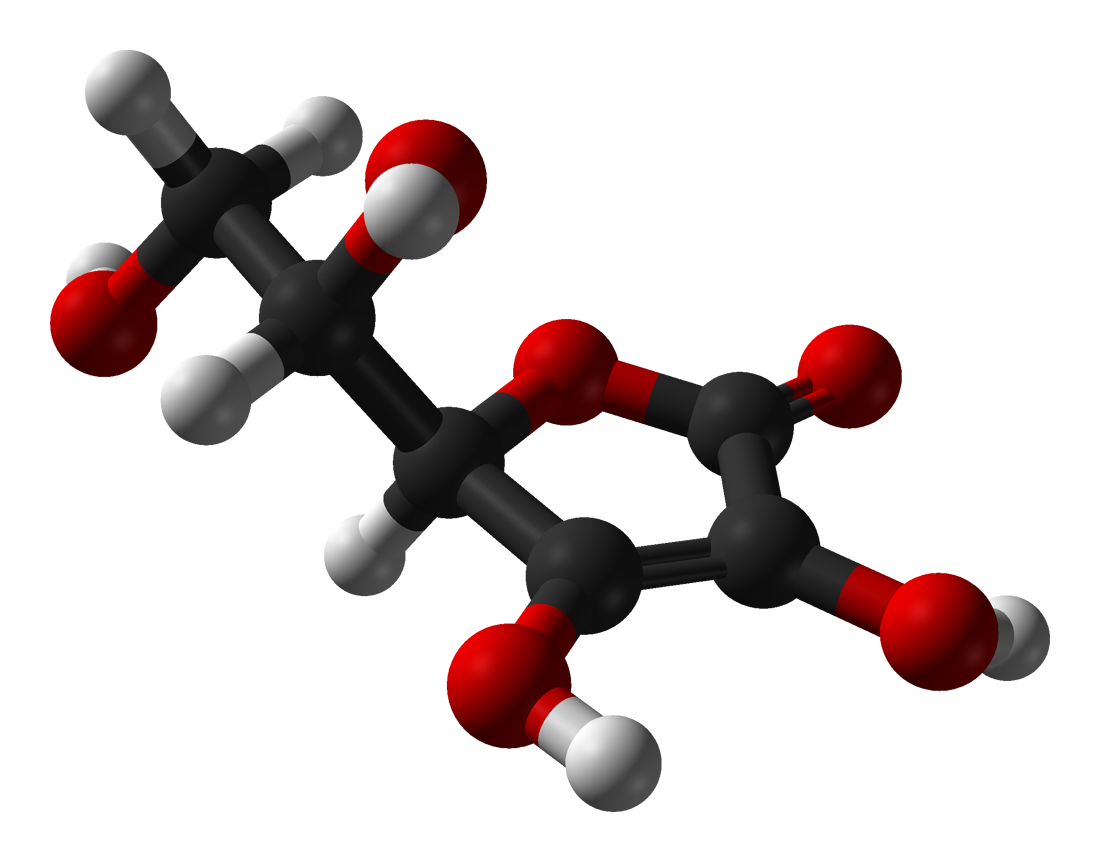 Ball-and-stick model of the L -ascorbic acid (vita...
more than was stated on the packaging.
These figures show that more Vitamin C is retained through processing than the manufactures realised. Alternatively the difference in amounts is so small it was not worth the manufactures taking it in to account. The other factor to take in to account is that the different juices were exposed to air so oxidisation of Vitamin C could have occurred. Heat and light both degrade vitamin C.
3. As for Q2. Discuss the results you obtained for part B of the practical. Are the results you obtained in line with what you would have predicted? If not, how can you explain any differences?
Pie chart showing class averages in Percentages.
Table showing class averages when Ascorbic acid is heated.
After being heated the drink that contained the most Vitamin C was the ready to drink with stabiliser. The stabiliser helped to prevent...