1
PART I -Ââ Best Wavelength INTRODUCTION This experiment is used to determine the concentration of unknown solution using given information: First to find out the best wavelength for absorption between 2 dyes using spectrophotometer; based the relationships observed between concentration and absorbance in the best wavelength, we can then calculate the concentration of unknown using Beer's Law.
OBJECTIVE Screen the visible spectrum of red and yellow dye (with same molarity) using spectrophotometer, to find the best wavelength in range of 350 to 650nm that is also high in absorbance and low in interference for both dyes.
DATA The screening process shown by graph below (Figure 1), the levels of absorbance change of red and yellow dyes under different wavelength ranging from 350nm to 650nm.
(Figure 1. The absorbance of Red and Yellow dye under wavelength range from 350-Ââ650nm. Point A and Point B represents the best wavelength for Red and Yellow Dye. Both Red and Yellow dye has 1.0mM in concentration.)
(Wavelength in nm) CONCLUSION Best wavelength of 535 nm has chosen for Red Dye due to it is the peak of absorbance and also has the lowest interference from Yellow Dye. Best wavelength for Yellow Dye is at 420 nm, this point is not the peak for the Yellow Dye curve, but does have the highest absorbance with low interference from Red Dye.
Absorb ance
B êïª
A êïª
2
PART II - Relations between Absorbance and Molarity OBJECTIVE Measure the absorbance of Red and Yellow Dye with difference concentration at their best wavelength (already determined in Part I), to establish the standard curve for both dyes. DATA Listed below are values of absorbance measured with both dye under different concentration that are correctly diluted, means no volume is lost upon mixing water and a solution. Absorbance...
 English: The wavelengths of the different colors i...
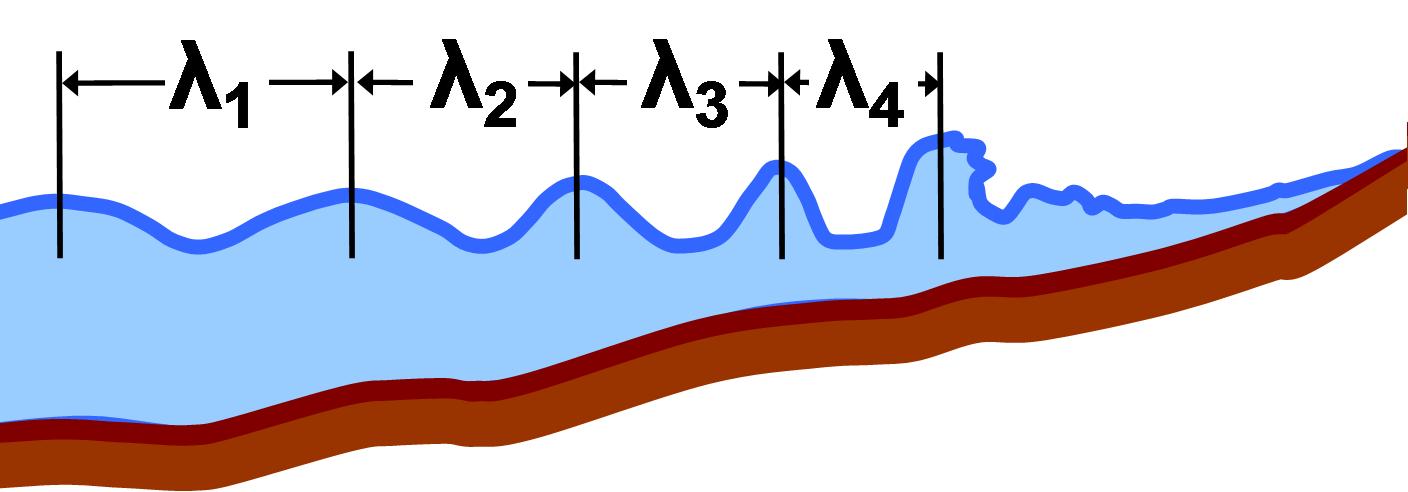 English: Local wavelengths defined as distances fr...
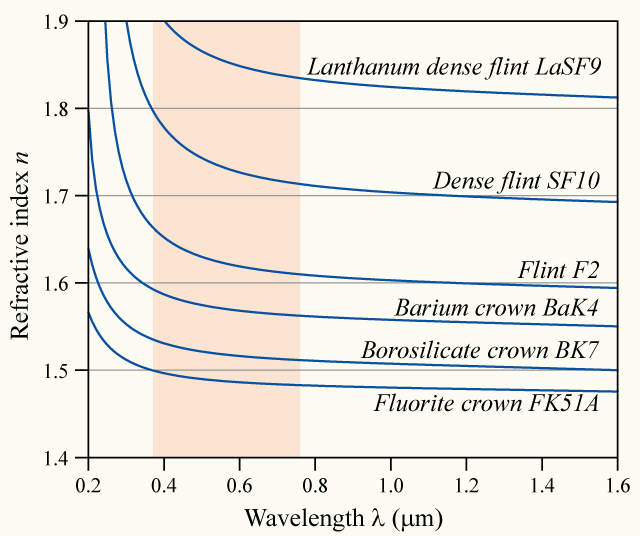 English: Plot of refractive index vs. wavelength o...