Appendix I.
Table 1.1.
Table 2.1.
OECD, Euromonitor International from International Monetary Fund (IMF), International Financial Statistics
Table 3.1 Denmark's export by commodity group
Table 5.1 Denmark's export market
http://www.danishexporters.dk/scripts/danishexporters/export.asp?landekode=GB
Appendix II.
Tables 1.2
Hungary's export, import and trade balance in the last 20 years
Kozponti Statisztikai hivatal (Hungarian Central Statistical Office)
Table 2.2 Graph on Hungary's external trade
OECD, Euromonitor International from International Monetary Fund (IMF), International Financial Statistics
Table 3.2.
In 2003 Hungary's imports were distributed among the following categories: (value in percentage of the total imports)
product | value |
Consumer goods | 12,4 % |
Food | 2,0% |
Fuels | 4,8% |
Industrial supplies | 28,6% |
Machinery | 35,1% |
Transportation | 12,9% |
other | 4,2% |
Table 4.2.
Hungary's export market in 2003 (value in percentage of total exports)
product | value |
Manufactured goods | 82 % |
Apparel | 4,4% |
Polymers | 2,2 % |
Meat | 2,1% |
Table 5.2.
Main Hungarian agricultural exports in 2003 (value in millions US dollars)
product | value |
Spelt wheat | 134,9 |
Maize | 132,7 |
Dog food | 93,1 |
Frozen pork | 84,3 |
Sunflower seed | 74,9 |
Table 6.2.
Principal trading partners in 2006 (in millions of US dollars)
country | percentage of total trade | exports | imports | balance |
Germany | 31,4 % | 10,471 | 8,213 | 2,258 |
Austria | 6,8% | 2,443 | 2,366 | 77 |
Italy | 5,6% | 1,654 | 2,407 | -753 |
Netherlands | 3,4% | 1,522 | 708 | 814 |
United States | 1,475 | 1,224 | 251 | |
France | 5,7% | 1,470 | 1,401 | 69 |
United Kingdom | 5,1% | 1,156 | 1,017 | 139 |
Belgium | 878 | 721 | 157 | |
Russian Federation | 5,7% (on supply) | 455 | 2,589 | -2,134 |
Japan | 3,1% (on supply) | 159 | 1,701 | -1,542 |
 Yugoslavia 1988
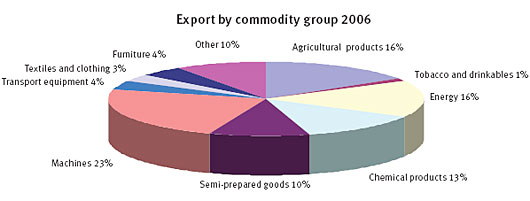 Figure 1
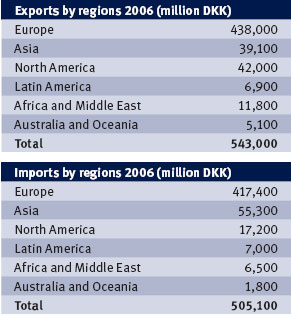 Figure 2
http://www.nationsencyclopedia.com/Europe/Hungary-FOREIGN-TRADE.html
Table 7.2
�
Appendix III. External trade of Denmark and Hungary
Table 1.3
Global Market Information Database
Table 2.3
Global Market Information Database
�
Appendix IV. Migration of Denmark
Table 1.4
Statistics Denmark
Table 2.4 Danish immigrants by country in percentage
1984 | 2000 | |
Nordic Countries | 16,3 | 11,6 |
EU Countries | 24,3 | 16,4 |
Turkey | 13,7 | 9,8 |
Western European Countries (incl. ex-Yugoslavia | 12,8 | 19,5 |
Africa | 6,0 | 9,0 |
North America | 4,2 | 2,4 |
South & Latin America | 2,8 | 2,0 |
Sri Lanka, Iran, Iraq | 0,9 | 10,2 |
Vietnam | 2,8 | 2,8 |
Pakistan | 7,3 | 3,3 |
Other | 8,8 | 13,0 |
Total | 100 | 100 |
Statistics Denmark
�
Appendix V. Migration of Hungary
Table 1.5 Net migration in Hungary
Global Market Information Database
Table 2.5 Hungarian immigrants by country of origin
1987 | 1988 | 1989 | 1990 | 1991 | 1992 | 1993 | 1994 | 1995 | 1996 | Total | |
Romania | 2,064 | 17,779 | 26,592 | 29,617 | 10,940 | 6,489 | 6,068 | 4,242 | 4,701 | 3,812 | 112,334 |
Former Yugoslavia | 416 | 501 | 527 | 426 | 4,030 | 3,458 | 5,229 | 2,538 | 1,641 | 1,043 | 19,809 |
Former USSR | 912 | 1,035 | 1,002 | 1,586 | 1,961 | 1,667 | 1,665 | 1,869 | 1,769 | 1,917 | 15,383 |
Other Central and Easterm Europe | 1,794 | 1,413 | 1,606 | 1,160 | 490 | 500 | 423 | 499 | 601 | 513 | 8,383 |
European Union | 812 | 813 | 1,336 | 1,343 | 1,397 | 1,046 | 1,031 | 1,347 | 1,305 | 1,357 | 11,787 |
Other OECD | 194 | 273 | 357 | 805 | 853 | 650 | 573 | 785 | 897 | 890 | 6,277 |
Other | 2,126 | 1,665 | 2,313 | 2,305 | 3,303 | 1,303 | 1,408 | 1,442 | 2,271 | 3,006 | 21,142 |
Total | 8,318 | 23,479 | 33,733 | 37,242 | 22,974 | 15,113 | 16,397 | 12,752 | 13,185 | 12,537 | 195,730 |
Registry of foreign nationals with long-term residence permits in Hungary, Ministry of the Interior
�
Appendix VI. migration of Denmark and Hungary
Table 3.6
Eurostat Statistics
� EMBED Excel.Chart.8 \s ���
� EMBED Excel.Chart.8 \s ���
� EMBED Excel.Chart.8 \s ���
� EMBED Excel.Chart.8 \s ���
� EMBED Excel.Chart.8 \s ���
�PAGE � �PAGE �8�
_1258293316.xls
Chart16
| 8538.13 | 8223.68 | 314.45 |
| 9165.43 | 9598.67 | -433.24 |
| 9555.56 | 9841.47 | -285.91 |
| 9949.37 | 9344.78 | 604.59 |
| 10066.6 | 8709.07 | 1357.53 |
| 9597.78 | 8670.79 | 926.99 |
| 10199.2 | 11417.3 | -1218.1 |
| 10663.5 | 11106.8 | -443.3 |
| 8886.36 | 12468.4 | -3582.04 |
| 10434.2 | 14265.9 | -3831.7 |
| 12801.4 | 15379.5 | -2578.1 |
| 15631 | 18057.7 | -2426.7 |
| 18989.6 | 21115.4 | -2125.8 |
| 22991.6 | 25678.8 | -2687.2 |
| 24949.9 | 27922.8 | -2972.9 |
| 28015.9 | 31955.1 | -3939.2 |
| 30529.7 | 33724.5 | -3194.8 |
| 34511.6 | 37787.5 | -3275.9 |
| 42531.9 | 47601.6 | -5069.7 |
| 54892.3 | 59636.5 | -4744.2 |
| 62178.8 | 65783.3 | -3604.5 |
| 74216.4 | 77206.1 | -2989.7 |
Sheet1
| migration data from eurostat | ||||||||||||||||||||||||
| Hungary's migration | ||||||||||||||||||||||||
| 1985 | 1990 | 1995 | 2000 | 2005 | ||||||||||||||||||||
| International migration stock (% of population) | 3 | 3 | 3 | 3 | 3 | |||||||||||||||||||
| International migration stock, total | 339023 | 347510 | 293266 | 295990 | 316209 | |||||||||||||||||||
| Net migration | -65585 | -122622 | 100708 | 85000 | 65000 | |||||||||||||||||||
| denmark's migration | ||||||||||||||||||||||||
| 1985 | 1990 | 1995 | 2000 | 2005 | ||||||||||||||||||||
| International migration stock (% of population) | 4 | 4 | 5 | 6 | 7 | |||||||||||||||||||
| International migration stock, total | 190109 | 220193 | 249747 | 304249 | 388535 | |||||||||||||||||||
| Net migration | 9843 | 30114 | 58366 | 73469 | 45603 | |||||||||||||||||||
| total inflows of foreign population Dk-Hu | ||||||||||||||||||||||||
| 1995 | 1996 | 1997 | 1998 | 1999 | 2000 | 2001 | 2002 | 2003 | 2004 | 2005 | ||||||||||||||
| Denmark | 32.97 | 24.747 | 20.436 | 21.277 | 20.28 | 22.903 | 25.202 | 22.032 | 18.742 | 18.799 | .. | |||||||||||||
| Hungary | 14.008 | 13.734 | 13.283 | 16.052 | 20.151 | 20.184 | 20.308 | 17.972 | 19.365 | 22.164 | 18.809 | |||||||||||||
| total outflows of foreign population DK-HU | ||||||||||||||||||||||||
| 1995 | 1996 | 1997 | 1998 | 1999 | 2000 | 2001 | 2002 | 2003 | 2004 | 2005 | ||||||||||||||
| Denmark | 5.26 | 5.95 | 6.715 | 7.708 | 8.182 | 8.31 | 8.892 | 8.734 | 8.738 | 9.414 | .. | |||||||||||||
| Hungary | 2.401 | 2.833 | 1.928 | 2.343 | 2.46 | 2.208 | 1.944 | 2.388 | 2.553 | 3.466 | 3.846 | |||||||||||||
| data from oecd | ||||||||||||||||||||||||
| total migration HU | ||||||||||||||||||||||||
| 1995 | 1996 | 1997 | 1998 | 1999 | 2000 | 2001 | 2002 | 2003 | 2004 | 2005 | ||||||||||||||
| immigration | 14.008 | 13.734 | 13.283 | 16.052 | 20.151 | 20.184 | 20.308 | 17.972 | 19.365 | 22.164 | 18.809 | |||||||||||||
| otflow of foreign population | 2.401 | 2.833 | 1.928 | 2.343 | 2.46 | 2.208 | 1.944 | 2.388 | 2.553 | 3.466 | 3.846 | |||||||||||||
| total migration-DK | ||||||||||||||||||||||||
| 1995 | 1996 | 1997 | 1998 | 1999 | 2000 | 2001 | 2002 | 2003 | 2004 | 2005 | ||||||||||||||
| immigration | 32.97 | 24.747 | 20.436 | 21.277 | 20.28 | 22.903 | 25.202 | 22.032 | 18.742 | 18.799 | .. | |||||||||||||
| outflow of foreign population | 5.26 | 5.95 | 6.715 | 7.708 | 8.182 | 8.31 | 8.892 | 8.734 | 8.738 | 9.414 | .. | |||||||||||||
| immigration and emmigration in denmark (statbank) | ||||||||||||||||||||||||
| 1983 | 1984 | 1985 | 1986 | 1987 | 1988 | 1989 | 1990 | 1991 | 1992 | 1993 | 1994 | 1995 | 1996 | 1997 | 1998 | 1999 | 2000 | 2001 | 2002 | 2003 | 2004 | 2005 | 2006 | |
| Immigrated | 27718 | 29035 | 36214 | 38932 | 36296 | 35051 | 38391 | 40715 | 43567 | 43377 | 43400 | 44961 | 63187 | 54445 | 50105 | 51372 | 50236 | 52915 | 55984 | 52778 | 49754 | 49860 | 52458 | 56750 |
| Emigrated | 25999 | 25053 | 26715 | 27928 | 30123 | 34544 | 34949 | 32383 | 32629 | 31915 | 32344 | 34710 | 34630 | 37312 | 38393 | 40340 | 41340 | 43417 | 43980 | 43481 | 43466 | 45017 | 45869 | 46786 |
| danish immigration by continents | ||||||||||||||||||||||||
| 1983 | 1984 | 1985 | 1986 | 1987 | 1988 | 1989 | 1990 | 1991 | 1992 | 1993 | 1994 | 1995 | 1996 | 1997 | 1998 | 1999 | 2000 | 2001 | 2002 | 2003 | 2004 | 2005 | ||
| EU Countries | 4843 | 5098 | 6012 | 6217 | 5984 | 5560 | 5440 | 5819 | 6380 | 6363 | 7070 | 8179 | 7763 | 9192 | 9698 | 10314 | 9873 | 10616 | 11445 | 10537 | 10038 | 11203 | 13291 | |
| Europe (excl. EU Countries) | 2387 | 2811 | 3621 | 3925 | 4025 | 3881 | 3796 | 3719 | 4603 | 3881 | 3419 | 4008 | 21649 | 10431 | 6688 | 6031 | 5780 | 5937 | 6401 | 6383 | 5882 | 6161 | 6196 | |
| Africa | 516 | 753 | 824 | 979 | 1041 | 967 | 1184 | 1417 | 1844 | 1765 | 2385 | 2363 | 2606 | 3937 | 3082 | 2704 | 2234 | 2071 | 2141 | 1944 | 1619 | 1361 | 1016 | |
| North America | 1499 | 1644 | 1757 | 1855 | 1799 | 1727 | 1583 | 1800 | 1789 | 1648 | 1610 | 1451 | 1609 | 1591 | 1591 | 1698 | 1685 | 1725 | 1754 | 1815 | 1826 | 1986 | 2248 | |
| South and Central America | 271 | 287 | 264 | 313 | 405 | 434 | 466 | 575 | 682 | 558 | 557 | 542 | 578 | 608 | 686 | 726 | 856 | 850 | 790 | 805 | 648 | 643 | 685 | |
| Asia | 1962 | 2454 | 7292 | 8671 | 6401 | 5469 | 6270 | 5892 | 6201 | 6761 | 4952 | 3942 | 4410 | 5182 | 5171 | 6760 | 5620 | 7359 | 8385 | 7313 | 7008 | 5836 | 5769 | |
| danish immigrants by countries | ||||||||||||||||||||||||
| 1983 | 1984 | 1985 | 1986 | 1987 | 1988 | 1989 | 1990 | 1991 | 1992 | 1993 | 1994 | 1995 | 1996 | 1997 | 1998 | 1999 | 2000 | 2001 | 2002 | 2003 | 2004 | 2005 | ||
| Yugoslavia (former) | 209 | 299 | 435 | 511 | 587 | 610 | 604 | 666 | 803 | 552 | 272 | 215 | 650 | 2282 | 195 | 384 | 281 | 261 | 213 | 174 | 141 | 86 | 44 | |
| Poland | 218 | 311 | 1003 | 684 | 807 | 891 | 725 | 732 | 734 | 619 | 513 | 424 | 423 | 523 | 538 | 649 | 611 | 665 | 754 | 821 | 864 | 1157 | 1984 | |
| Turkey | 529 | 749 | 1417 | 1593 | 1790 | 1612 | 1405 | 1174 | 1915 | 1304 | 848 | 721 | 990 | 1402 | 1074 | 1287 | 1256 | 1183 | 1194 | 1116 | 502 | 488 | 426 | |
| Somalia | 10 | 13 | 18 | 23 | 48 | 79 | 198 | 195 | 578 | 699 | 1263 | 1034 | 1257 | 2010 | 1505 | 1005 | 568 | 421 | 449 | 478 | 394 | 215 | 119 | |
| Iraq | 19 | 91 | 480 | 385 | 221 | 442 | 504 | 408 | 433 | 1050 | 770 | 524 | 735 | 1015 | 954 | 1908 | 893 | 1369 | 1404 | 994 | 756 | 383 | 232 | |
| Iran | 54 | 627 | 3917 | 1134 | 1045 | 1000 | 652 | 707 | 779 | 552 | 393 | 270 | 233 | 356 | 336 | 355 | 311 | 556 | 662 | 457 | 319 | 228 | 214 | |
| Lebanon | 37 | 38 | 409 | 2448 | 1651 | 1104 | 1691 | 1347 | 1289 | 1339 | 537 | 271 | 234 | 257 | 242 | 324 | 248 | 357 | 261 | 248 | 111 | 129 | 88 | |
| Sri Lanka | 86 | 115 | 491 | 2369 | 1105 | 262 | 486 | 257 | 336 | 393 | 353 | 338 | 440 | 316 | 214 | 190 | 151 | 139 | 147 | 121 | 91 | 49 | 73 | |
| population, net migration in Hungary, DK | ||||||||||||||||||||||||
| Denmark | ||||||||||||||||||||||||
| 1985 | 1986 | 1987 | 1988 | 1989 | 1990 | 1991 | 1992 | 1993 | 1994 | 1995 | 1996 | 1997 | 1998 | 1999 | 2000 | 2001 | 2002 | 2003 | 2004 | 2005 | 2006 | 2007 | ||
| Foreign citizens, Denmark | - | - | - | - | - | 150.64 | 160.64 | 169.53 | 180.1 | 189.01 | 196.71 | 222.75 | 237.7 | 249.63 | 256.28 | 259.36 | 258.63 | 266.73 | 265.42 | 271.21 | 267.6 | 267.86 | - | |
| Net migration, Denmark | 9.79 | 11.31 | 6.38 | 0.66 | 3.68 | 8.55 | 10.88 | 11.58 | 11.47 | 10.51 | 28.67 | 17.5 | 11.99 | 11 | 9.38 | 10.09 | 12.02 | 9.61 | 7.03 | 4.96 | 6.73 | 9.96 | 5.47 | |
| Population, Denmark | 5111.11 | 5116.27 | 5124.79 | 5129.25 | 5129.78 | 5135.41 | 5146.47 | 5162.13 | 5180.61 | 5196.64 | 5215.72 | 5251.03 | 5275.12 | 5294.86 | 5313.58 | 5330.02 | 5349.21 | 5368.35 | 5383.51 | 5397.64 | 5411.41 | 5427.46 | 5446.93 | |
| Hungary | ||||||||||||||||||||||||
| 1985 | 1986 | 1987 | 1988 | 1989 | 1990 | 1991 | 1992 | 1993 | 1994 | 1995 | 1996 | 1997 | 1998 | 1999 | 2000 | 2001 | 2002 | 2003 | 2004 | 2005 | 2006 | 2007 | ||
| Foreign citizens, Hungary | - | - | - | - | - | 127.02 | 129.41 | 131.81 | 134.2 | 138 | 140 | 140 | 142.5 | 148.3 | 150.2 | 153.1 | 115.81 | 116.43 | 115.89 | 130.11 | 143.77 | 151.7 | - | |
| Net migration, Hungary | -41.01 | -50.83 | -52.04 | -39.9 | -8.62 | 18.31 | 18.1 | 18.45 | 18.19 | 17.97 | 17.91 | 17.87 | 17.57 | 17.26 | 16.79 | 16.66 | 9.69 | 3.54 | 15.56 | 18.16 | 17.27 | 14.2 | 14.17 | |
| Population, Hungary | 10657.42 | 10599 | 10529.28 | 10460.48 | 10404.83 | 10374.82 | 10373.15 | 10373.64 | 10365.04 | 10350.02 | 10336.7 | 10321.23 | 10301.24 | 10279.73 | 10253.42 | 10221.64 | 10200.3 | 10174.85 | 10142.36 | 10116.74 | 10097.55 | 10076.58 | 10057.88 | |
| Sources: | ||||||||||||||||||||||||
| 1 Population: national estimates at January 1st: Euromonitor International from national statistics/UN | ||||||||||||||||||||||||
| 2 Foreign citizens: Euromonitor International from trade sources/national statistics | ||||||||||||||||||||||||
| 3 Net migration: Euromonitor International from national statistical offices/UN | ||||||||||||||||||||||||
| exports, imports, trade balance | ||||||||||||||||||||||||
| Denmark | ||||||||||||||||||||||||
| 1985 | 1986 | 1987 | 1988 | 1989 | 1990 | 1991 | 1992 | 1993 | 1994 | 1995 | 1996 | 1997 | 1998 | 1999 | 2000 | 2001 | 2002 | 2003 | 2004 | 2005 | 2006 | |||
| Exports, Denmark | 17090.2 | 21285.6 | 25675.4 | 28502.4 | 29564.3 | 37037.2 | 37886.2 | 41675.7 | 38206.5 | 43120 | 51478.1 | 51479.9 | 49118.6 | 48839.2 | 50399.4 | 50380.2 | 51067.7 | 56303.5 | 65267 | 75619.9 | 83561.5 | 91710.3 | ||
| Imports, Denmark | 18245.3 | 22878.4 | 25498.6 | 27032.9 | 27801.4 | 33248.2 | 34057.2 | 35521.1 | 31330.6 | 36588.7 | 45728.1 | 45003.9 | 44406.3 | 46330.1 | 44519.3 | 44356 | 44123.8 | 48886.5 | 56216.5 | 66886.3 | 74258.9 | 85110.4 | ||
| Trade balance, Denmark | -1155.1 | -1592.8 | 176.8 | 1469.5 | 1762.9 | 3789 | 3829 | 6154.6 | 6875.9 | 6531.3 | 5750 | 6476 | 4712.3 | 2509.1 | 5880.1 | 6024.2 | 6943.9 | 7417 | 9050.5 | 8733.6 | 9302.6 | 6599.9 | ||
| Hungary | ||||||||||||||||||||||||
| 1985 | 1986 | 1987 | 1988 | 1989 | 1990 | 1991 | 1992 | 1993 | 1994 | 1995 | 1996 | 1997 | 1998 | 1999 | 2000 | 2001 | 2002 | 2003 | 2004 | 2005 | 2006 | |||
| Exports, Hungary | 8538.13 | 9165.43 | 9555.56 | 9949.37 | 10066.6 | 9597.78 | 10199.2 | 10663.5 | 8886.36 | 10434.2 | 12801.4 | 15631 | 18989.6 | 22991.6 | 24949.9 | 28015.9 | 30529.7 | 34511.6 | 42531.9 | 54892.3 | 62178.8 | 74216.4 | ||
| Imports, Hungary | 8223.68 | 9598.67 | 9841.47 | 9344.78 | 8709.07 | 8670.79 | 11417.3 | 11106.8 | 12468.4 | 14265.9 | 15379.5 | 18057.7 | 21115.4 | 25678.8 | 27922.8 | 31955.1 | 33724.5 | 37787.5 | 47601.6 | 59636.5 | 65783.3 | 77206.1 | ||
| Trade balance, Hungary | 314.45 | -433.24 | -285.91 | 604.59 | 1357.53 | 926.99 | -1218.1 | -443.3 | -3582.04 | -3831.7 | -2578.1 | -2426.7 | -2125.8 | -2687.2 | -2972.9 | -3939.2 | -3194.8 | -3275.9 | -5069.7 | -4744.2 | -3604.5 | -2989.7 | ||
| 1 Imports: Euromonitor International from International Monetary Fund (IMF), International Financial Statistics | ||||||||||||||||||||||||
| 2 Exports: Euromonitor International from International Monetary Fund (IMF), International Financial Statistics | ||||||||||||||||||||||||
| 3 Trade balance: Euromonitor International from International Monetary Fund (IMF), International Financial Statistics | ||||||||||||||||||||||||
| 1985 | 1986 | 1987 | 1988 | 1989 | 1990 | 1991 | 1992 | 1993 | 1994 | 1995 | 1996 | 1997 | 1998 | 1999 | 2000 | 2001 | 2002 | 2003 | 2004 | 2005 | 2006 | 2007 | ||
| Denmark | ||||||||||||||||||||||||
| 16548.53 | 20309.82 | 24422.14 | 26297.79 | 26929.39 | 33322.93 | 35899.17 | 41630.48 | 37619.8 | 42124.7 | 50388.43 | 50770.24 | 52648.49 | 52477.98 | 54440.82 | 55578.97 | 56172.04 | 61717.5 | 72761.77 | 83881.22 | 95725.13 | 107209.12 | - | ||
| - | - | - | - | 28046.2 | 34842.8 | 35713.06 | 39553.11 | 37170.99 | 41602.37 | 48789.13 | 48884.54 | 48800.43 | 47709.99 | 49027.81 | 49210.3 | 50977.56 | 55685.47 | 64613.99 | 74792.64 | 82415.35 | 90118.24 | 95222.66 | ||
| 17468.74 | 21851.59 | 24255.99 | 25136.31 | 25085.39 | 30433.99 | 31144.51 | 34819.43 | 30109.73 | 35095.09 | 43679.54 | 42532.84 | 46219.28 | 48174.57 | 48855.06 | 49898.28 | 49601.1 | 54200.42 | 62898.42 | 74660.6 | 85286.62 | 99492.54 | 110598.12 | ||
| - | - | - | - | 26618.14 | 31575.71 | 32169.42 | 33590.32 | 30535.71 | 35436.45 | 43141.53 | 43126.35 | 44492.34 | 45700.68 | 44316.61 | 44586.86 | 44631.17 | 49312.59 | 56230.43 | 66895.19 | 74265.07 | 84510.99 | 92917.65 | ||
| Hungary | ||||||||||||||||||||||||
| 5798.4 | 6431.9 | 6584.76 | 7361.61 | 6953.34 | 7398.89 | 9003.3 | 9431.9 | 7633 | 13149.6 | 16562.7 | 17324.82 | 24676.81 | 29526.43 | 30888.29 | 35177 | 38697.72 | 43444.85 | 55806.88 | 76422.63 | 91268.13 | 114996.49 | - | ||
| - | - | - | - | - | 9587.6 | 10186.9 | 10054.98 | 8240.06 | 10699.84 | 12452.02 | 12632.79 | 19099.19 | 23005.02 | 25012.19 | 28091.79 | 30497.74 | 34336.58 | 43007.78 | 55468.25 | 63240.57 | 74055.48 | 81272.78 | ||
| 6187.4 | 7138.98 | 7321.53 | 7307.9 | 6680.16 | 7093.43 | 9231.8 | 8619.7 | 9380.5 | 17210.3 | 18583 | 20029.38 | 26039.22 | 30927.84 | 33635.29 | 38989.2 | 41158.4 | 46540.5 | 60306.43 | 78658 | 89823.66 | 109767.26 | 120710.86 | ||
| - | - | - | - | - | 8646.5 | 11371.26 | 10873.58 | 11376.08 | 14553.61 | 15185.56 | 16042.64 | 21234.01 | 25706.39 | 28008.23 | 32079.45 | 33681.74 | 37611.57 | 46674.97 | 60248.67 | 66741.34 | 76978.58 | 83913.31 | ||
| Sources: | ||||||||||||||||||||||||
| 1 Foreign trade: Euromonitor International from trade sources/national statistics | ||||||||||||||||||||||||
| 2 Imports (cif) by origin: International Monetary Fund (IMF), Direction of Trade Statistics | ||||||||||||||||||||||||
| 3 Imports (cif) by commodity: United Nations, UN Trade Statistics | ||||||||||||||||||||||||
| 4 Exports (fob) by destination: International Monetary Fund (IMF), Direction of Trade Statistics | ||||||||||||||||||||||||
| 5 Exports (fob) by commodity: United Nations, UN Trade Statistics | ||||||||||||||||||||||||
| exports,imports by origin | ||||||||||||||||||||||||
| Denmark | ||||||||||||||||||||||||
| 1985 | 1986 | 1987 | 1988 | 1989 | 1990 | 1991 | 1992 | 1993 | 1994 | 1995 | 1996 | 1997 | 1998 | 1999 | 2000 | 2001 | 2002 | 2003 | 2004 | 2005 | 2006 | 2007 | ||
| Exports to Africa and the Middle East | 946.76 | 930.35 | 964.08 | 1170.47 | 1153.56 | 1650.44 | 1155.08 | 1686.62 | 1361.95 | 1634.94 | 1827.09 | 1407.98 | 1392.17 | 1410.42 | 1426.83 | 1332.85 | 1459.3 | 1639.89 | 1918.11 | 2119.83 | 2149.46 | 2002.33 | 2502.64 | |
| Exports to Asia-Pacific | 1055.57 | 1360.3 | 1863.53 | 2049.33 | 1969.42 | 2201.44 | 2350.54 | 2941.31 | 2868.25 | 3432.65 | 4304.39 | 4242.44 | 3897.13 | 3358.1 | 3692.14 | 3785.11 | 3855.94 | 4044.87 | 4916.76 | 5799.17 | 5925.29 | 6215.58 | 6257.59 | |
| Exports to Australasia | 143.16 | 141.92 | 162.89 | 183.35 | 213.15 | 195.66 | 182.6 | 212.89 | 229.78 | 282.5 | 317.66 | 331.2 | 339.31 | 326.85 | 371.68 | 368.58 | 358.91 | 426.7 | 565.37 | 823.29 | 751.11 | 855.18 | 1065.24 | |
| Exports to Europe, Denmark | 12120.82 | 15564.74 | 19129.26 | 20764.77 | 21475.94 | 27042.29 | 29839.11 | 33868.39 | 30340.04 | 33540.61 | 40812.41 | 41686.27 | 43736.32 | 44043.69 | 45220.04 | 45971.86 | 45871.88 | 50840.67 | 59964.08 | 69299.09 | 79726.2 | 90178.61 | 95408.43 | |
| Exports to EU-27, Denmark | 10011.43 | 12774 | 15816.75 | 17325.11 | 18221.29 | 22984.67 | 24352.63 | 27725.63 | 23572.72 | 25679.63 | 31307.92 | 31135.23 | 32839.48 | 32797.06 | 34490.85 | 36012.3 | 34961.19 | 38539.13 | 45475.03 | 52937.48 | 59639.18 | 65669.69 | 68871.65 | |
| Exports to Latin America | 360.12 | 336.91 | 292.83 | 348.5 | 361.96 | 352.46 | 615.55 | 852.88 | 740.72 | 835.92 | 952.35 | 862.75 | 824.94 | 799.31 | 720.11 | 791.5 | 734.78 | 763.61 | 762.39 | 895.23 | 982.31 | 1250.42 | 1198.89 | |
| Exports to USA | 1753.8 | 1796.25 | 1806.36 | 1589.21 | 1552.04 | 1700.2 | 1577.55 | 1882.94 | 1897.57 | 2185.27 | 1979.25 | 2032.93 | 2234.33 | 2263.84 | 2709.42 | 2994.22 | 3524.58 | 3569.16 | 4078.41 | 4379.78 | 5458.85 | 5778.21 | 7019.2 | |
| 1985 | 1986 | 1987 | 1988 | 1989 | 1990 | 1991 | 1992 | 1993 | 1994 | 1995 | 1996 | 1997 | 1998 | 1999 | 2000 | 2001 | 2002 | 2003 | 2004 | 2005 | 2006 | 2007 | ||
| Imports from Africa and the Middle East | 701.94 | 577.12 | 517.13 | 568.24 | 718.88 | 615.04 | 226.46 | 221.98 | 324.54 | 401.62 | 435.38 | 438.62 | 385.71 | 385.11 | 281.38 | 383.64 | 449.69 | 376.82 | 445.32 | 1032.44 | 1240.12 | 1018.84 | 741.62 | |
| Imports from Asia-Pacific | 1246.66 | 2023.24 | 2103.01 | 2230.99 | 2238.07 | 2735.05 | 2948.4 | 2870.83 | 2800.51 | 3365.31 | 3420.88 | 3321.99 | 3345.14 | 3521.7 | 3620.7 | 3803.75 | 3574.76 | 3765.01 | 5198.57 | 6528.32 | 7486.15 | 8507.46 | 9641.41 | |
| Imports from Australasia | 126.59 | 130.28 | 164.18 | 94.39 | 101.92 | 92.7 | 121.77 | 111.27 | 64.51 | 85.5 | 114.08 | 134.48 | 129.49 | 185.93 | 100.04 | 95.13 | 108.56 | 121.54 | 206.25 | 298.95 | 297.13 | 293.44 | 290.29 | |
| Imports from Europe, Denmark | 13719.41 | 17337.03 | 19541.31 | 20037.58 | 19482.56 | 24231.42 | 25068.33 | 28888.68 | 24732.42 | 28681.94 | 36807.26 | 35597.87 | 39090.2 | 40876.14 | 41966.32 | 42698.88 | 42503.87 | 47142.27 | 54190.53 | 63259.35 | 72745.07 | 85573.88 | 95170.63 | |
| Imports from EU-27 , Denmark | 11847.93 | 15119.29 | 16938 | 17251.97 | 16886.96 | 20723.34 | 21089.22 | 23810.06 | 19570.64 | 22465.24 | 29339.85 | 28056.12 | 31312.98 | 32597.66 | 33689.77 | 32917 | 32831.36 | 36936.74 | 42047.36 | 48508.5 | 53582.15 | 62099.2 | 68865.4 | |
| Imports from Latin America | 525.76 | 488.94 | 479.93 | 523.36 | 627.85 | 668.73 | 606.86 | 642.41 | 640.59 | 671.47 | 691.43 | 770.68 | 854.58 | 732.93 | 639.91 | 684.86 | 738.97 | 655.62 | 844.78 | 1046.61 | 1179.47 | 1225.86 | 1441.91 | |
| Imports from USA | 1074.85 | 1207.29 | 1350.91 | 1563.03 | 1778.96 | 1949.73 | 2011.93 | 1868.93 | 1417.15 | 1741.5 | 2058.38 | 2105.72 | 2242.96 | 2308.76 | 2018.14 | 1939.78 | 1964.76 | 1910.47 | 1827.72 | 2265.09 | 2064.45 | 2563.35 | 2650.81 | |
| Hungary | ||||||||||||||||||||||||
| 1985 | 1986 | 1987 | 1988 | 1989 | 1990 | 1991 | 1992 | 1993 | 1994 | 1995 | 1996 | 1997 | 1998 | 1999 | 2000 | 2001 | 2002 | 2003 | 2004 | 2005 | 2006 | 2007 | ||
| Exports to Africa and the Middle East | 685.78 | 470.92 | 452.91 | 539.66 | 441.29 | 416.32 | 483.9 | 337.8 | 258.8 | 204.3 | 385.4 | 318.2 | 312.09 | 321.13 | 260.75 | 306.2 | 380.03 | 579.28 | 1060.63 | 1376.06 | 1987.79 | 2496.7 | 2612.63 | |
| Exports to Asia-Pacific | 231.69 | 336.64 | 345 | 542.42 | 469.65 | 471.18 | 415.2 | 270.6 | 287.2 | 245 | 249.1 | 314.53 | 368.67 | 432.51 | 583.02 | 667.9 | 729.08 | 863.9 | 864.72 | 1262.16 | 1590.17 | 2395.77 | 2610.18 | |
| Exports to Australasia | 5.94 | 10.46 | 13.73 | 25.53 | 22.28 | 19.03 | 21.9 | 20.2 | 20.1 | 22 | 22.7 | 23.17 | 23.36 | 24.25 | 27.67 | 29.1 | 26.83 | 105.48 | 57.02 | 78.31 | 102.29 | 140.11 | 151.89 | |
| Exports to Europe, Hungary | 4528.43 | 5238.41 | 5340.3 | 5821.99 | 5558.88 | 6049.16 | 7627.7 | 8363.4 | 6626.8 | 12164.6 | 15417.3 | 16111.21 | 23239.31 | 27464.48 | 28530.58 | 32501.9 | 35858.59 | 40467.38 | 52247.7 | 71725.54 | 85301.03 | 107427.79 | 123281.3 | |
| Exports to EU-27, Hungary | 2499.69 | 2850.56 | 3150.48 | 3575.78 | 3691.71 | 4611.4 | 6188.2 | 6798.8 | 5198.1 | 7649.6 | 9295.3 | 9537.49 | 15468.55 | 18979.6 | 20976.69 | 23506.1 | 25298.73 | 28671.01 | 35698.04 | 46004.05 | 50838.35 | 59682.07 | 67571.99 | |
| Exports to Latin America | 119.4 | 121.8 | 104.11 | 93.81 | 106.52 | 74.75 | 100.4 | 48.5 | 41.7 | 48.1 | 53.5 | 70.75 | 77.34 | 175.98 | 154.25 | 157.8 | 164.97 | 184.92 | 169.49 | 262.04 | 306.19 | 348.06 | 341.86 | |
| Exports to USA | 197.08 | 214.4 | 286.96 | 293.63 | 318.71 | 339.53 | 322.5 | 343 | 373.5 | 430.5 | 413.1 | 464.33 | 618.62 | 1045.28 | 1298.67 | 1475 | 1495.25 | 1180.83 | 1342.31 | 1649.49 | 1892.89 | 2048.41 | 1843.46 | |
| 1985 | 1986 | 1987 | 1988 | 1989 | 1990 | 1991 | 1992 | 1993 | 1994 | 1995 | 1996 | 1997 | 1998 | 1999 | 2000 | 2001 | 2002 | 2003 | 2004 | 2005 | 2006 | 2007 | ||
| Imports from Africa and the Middle East | 183.48 | 113.18 | 181.83 | 154.71 | 71.55 | 345.92 | 370.4 | 49.5 | 50.4 | 83.2 | 141.9 | 203.97 | 177.88 | 201.24 | 196.14 | 200.1 | 236.07 | 207.38 | 227.47 | 141.69 | 174.8 | 180.83 | 284.62 | |
| Imports from Asia-Pacific | 323.96 | 506.75 | 544.53 | 522.94 | 464.8 | 488.09 | 637.6 | 494.9 | 657.3 | 783.5 | 841.3 | 1038.56 | 1919.81 | 2791.53 | 3293.7 | 4807.9 | 5156.75 | 6592.94 | 8676.99 | 8092.44 | 10365.59 | 11347.47 | 12252.41 | |
| Imports from Australasia | 31.56 | 14.82 | 13.23 | 19.71 | 12.82 | 8.61 | 371.2 | 7.5 | 5.6 | 5.2 | 6.6 | 14.41 | 18.08 | 27.26 | 20.28 | 25.4 | 32.17 | 24.93 | 45.67 | 36.78 | 20.89 | 17.94 | 39.53 | |
| Imports from Europe, Hungary | 5160.33 | 6096.77 | 6133.86 | 6105.05 | 5679.02 | 5796.14 | 7347.2 | 7541.9 | 7964.2 | 15658.6 | 16845.7 | 17909.72 | 22719.36 | 26392.14 | 28653.75 | 32232.9 | 33854.66 | 37798.42 | 49155.56 | 69073.59 | 77695.01 | 96719.45 | 106430.93 | |
| Imports from EU-27, Hungary | 3006.43 | 3554.95 | 3742.55 | 3778.36 | 3837.83 | 4425.68 | 6028.5 | 6350.6 | 6774.8 | 9714.6 | 10372 | 10714.35 | 14897.64 | 18307.48 | 20018.74 | 21226.2 | 22102.44 | 24241.35 | 30678.81 | 43620.6 | 46434.01 | 55031.83 | 60937.03 | |
| Imports from Latin America | 218.61 | 200.01 | 182.61 | 285.47 | 222.49 | 216.28 | 184.8 | 165 | 169.5 | 194.1 | 223.8 | 246.69 | 318 | 416.87 | 442.87 | 422.8 | 400.47 | 442.79 | 548.53 | 240.9 | 331.82 | 282.2 | 257.84 | |
| Imports from USA | 244.98 | 194.24 | 251.26 | 210.01 | 221.8 | 227.94 | 299.4 | 322.7 | 500.4 | 451.7 | 481.7 | 568.89 | 797.73 | 992.82 | 965.07 | 1223.7 | 1410.18 | 1373.19 | 1524.1 | 988.66 | 1095.37 | 1105.18 | 1312.54 | |
| Sources: | ||||||||||||||||||||||||
| 1 Imports (cif) from Asia-Pacific: International Monetary Fund (IMF), Direction of Trade Statistics | ||||||||||||||||||||||||
| 2 Imports (cif) from USA: International Monetary Fund (IMF), Direction of Trade Statistics | ||||||||||||||||||||||||
| 3 Exports (fob) to Asia-Pacific: International Monetary Fund (IMF), Direction of Trade Statistics | ||||||||||||||||||||||||
| 4 Exports (fob) to USA: International Monetary Fund (IMF), Direction of Trade Statistics | ||||||||||||||||||||||||
| 5 Exports (fob) to Latin America: Euromonitor International from trade sources/national statistics | ||||||||||||||||||||||||
| 6 Imports (cif) from Latin America: Euromonitor International from trade sources/national statistics | ||||||||||||||||||||||||
| 7 Imports (cif) from Europe: Euromonitor International from trade sources/national statistics | ||||||||||||||||||||||||
| 8 Exports (fob) to Europe: Euromonitor International from trade sources/national statistics | ||||||||||||||||||||||||
| 9 Imports (cif) from Australasia: Euromonitor International from trade sources/national statistics | ||||||||||||||||||||||||
| 10 Exports (fob) to Australasia: Euromonitor International from trade sources/national statistics | ||||||||||||||||||||||||
| 11 Exports (fob) to Africa and the Middle East: Euromonitor International from trade sources/national statistics | ||||||||||||||||||||||||
| 12 Imports (cif) from Africa and the Middle East: Euromonitor International from trade sources/national statistics | ||||||||||||||||||||||||
| 13 Imports (cif) from EU-27: Euromonitor International from trade sources/national statistics | ||||||||||||||||||||||||
| 14 Exports (fob) to EU-27: Euromonitor International from trade sources/national statistics | ||||||||||||||||||||||||
| exports, imports by commodity | ||||||||||||||||||||||||
| Denmark | ||||||||||||||||||||||||
| 1989 | 1990 | 1991 | 1992 | 1993 | 1994 | 1995 | 1996 | 1997 | 1998 | 1999 | 2000 | 2001 | 2002 | 2003 | 2004 | 2005 | 2006 | 2007 | ||||||
| Exports of food and live animals | 7200.95 | 8721.86 | 9070.13 | 9683.81 | 8980.06 | 9803.91 | 10867.2 | 10455.51 | 10632.09 | 9992.92 | 9455.12 | 8963.19 | 9592.5 | 9943.41 | 11348 | 12658.8 | 13190.44 | 14542.7 | 15013.02 | |||||
| Exports of beverages and tobacco | 288.91 | 369.2 | 390.33 | 422.76 | 412.03 | 430.59 | 539.46 | 483.66 | 492.12 | 479.83 | 470.76 | 545.23 | 475.19 | 614.87 | 821.56 | 874.91 | 880.33 | 965.79 | 989.35 | |||||
| Exports of crude materials exc. fuels | 1511.47 | 1636.85 | 1544.71 | 1538.25 | 1292.71 | 1460.76 | 1760.43 | 1779.35 | 1776.86 | 1598.52 | 1502.94 | 1490.19 | 1571.8 | 1902.65 | 2297.19 | 2712.96 | 2745.1 | 3289.39 | 3569.5 | |||||
| Exports of mineral fuels | 843.95 | 1163.87 | 1287.91 | 1356.07 | 1095.3 | 1033.55 | 1260.46 | 2097.24 | 1827.83 | 1310.49 | 1846.62 | 3450.36 | 2917.97 | 3441.58 | 4234.03 | 5869.14 | 7751.65 | 9237.32 | 10563.68 | |||||
| Exports of oils and fats | 133.06 | 151.5 | 146.93 | 165.96 | 139.79 | 189.22 | 278.79 | 264.11 | 278.71 | 263.62 | 232.01 | 181.76 | 191.87 | 223.02 | 272.06 | 366.89 | 418.78 | 478.23 | 521.07 | |||||
| Exports of chemicals | 2466.72 | 2951.75 | 2997.33 | 3571.56 | 3386.17 | 3807.33 | 4725.03 | 4691.39 | 5007.01 | 4788.7 | 5405.76 | 5378.63 | 6080.82 | 6809.58 | 8548.54 | 9623.99 | 10850.25 | 10964.25 | 11093.15 | |||||
| Exports of basic manufactures | 3102.16 | 3863.75 | 3876.41 | 4227.63 | 3691.52 | 4137.32 | 5256.56 | 5028.82 | 5265.22 | 5291.12 | 5421.68 | 5161.9 | 5145.62 | 5526.11 | 6471.07 | 7408.41 | 7824.54 | 9152.66 | 9769.61 | |||||
| Exports of machinery and transport equipment | 7033.82 | 9196.7 | 9029.22 | 10447.73 | 8981.59 | 10267.63 | 12260 | 12490 | 13158.32 | 13184.6 | 13682.95 | 13027.43 | 13983.45 | 16356.54 | 17829.6 | 20658.27 | 23176.97 | 24871.01 | 26412.85 | |||||
| Exports of miscellaneous manufactured goods | 4029.24 | 5122.99 | 5495.67 | 6138.08 | 5587.75 | 6089.86 | 7192.77 | 7020.28 | 7610.95 | 7953.47 | 8186.57 | 8266.84 | 8248.24 | 8660.25 | 10371.73 | 11872.98 | 12461.16 | 13815.02 | 14449.52 | |||||
| Exports of other goods | 1435.92 | 1664.34 | 1874.42 | 2001.26 | 3604.07 | 4382.2 | 4648.42 | 4574.18 | 2751.32 | 2846.73 | 2823.41 | 2744.75 | 2770.09 | 2207.46 | 2420.21 | 2746.29 | 3116.13 | 2801.86 | 2840.91 | |||||
| 1989 | 1990 | 1991 | 1992 | 1993 | 1994 | 1995 | 1996 | 1997 | 1998 | 1999 | 2000 | 2001 | 2002 | 2003 | 2004 | 2005 | 2006 | 2007 | ||||||
| Imports of food and live animals | 2798.28 | 3215.57 | 3420.19 | 3750.91 | 3471.02 | 3729.09 | 4310.89 | 4383.43 | 4587.06 | 4593.55 | 4440.47 | 4222.63 | 4276.3 | 4749.94 | 5654.87 | 6495.11 | 6963.06 | 7780.22 | 8400.01 | |||||
| Imports of beverages and tobacco | 305.21 | 374.71 | 387.58 | 438.29 | 432.56 | 451.79 | 546.4 | 574.35 | 696.92 | 635.87 | 647.34 | 588.83 | 599.84 | 678.56 | 830.96 | 926.03 | 941.07 | 1034.05 | 1113.04 | |||||
| Imports of crude materials exc. fuels | 1167.22 | 1238.93 | 1133.85 | 1231.34 | 1052.96 | 1345.09 | 1609.4 | 1478.74 | 1693.53 | 1692.57 | 1555.88 | 1466.47 | 1490.22 | 1589.2 | 1902.72 | 2064.78 | 2020.98 | 2456.58 | 2685.42 | |||||
| Imports of mineral fuels | 1922.46 | 2203.22 | 1694.27 | 1596.23 | 1534.07 | 1469.1 | 1436.07 | 1648.89 | 1700.64 | 1301.8 | 1361.98 | 2522.51 | 1826.47 | 2166.49 | 2656.49 | 3565.85 | 5009.25 | 4983.65 | 5259.96 | |||||
| Imports of oils and fats | 149.53 | 152.06 | 149.04 | 187.49 | 163.81 | 188.05 | 229.34 | 246.87 | 266.16 | 302.83 | 220.71 | 182.73 | 208.07 | 234.53 | 287.21 | 365.5 | 415.87 | 508.48 | 550.97 | |||||
| Imports of chemicals | 3013.89 | 3609.71 | 3572.03 | 3875.41 | 3394.21 | 3841.75 | 4821.33 | 4466.65 | 4693.86 | 4725.92 | 4500.65 | 4384.11 | 4598.01 | 5245.64 | 6194.44 | 7318.08 | 8096.08 | 9118.75 | 9980.04 | |||||
| Imports of basic manufactures | 5289.27 | 6187.39 | 6052.39 | 6467.16 | 5135.23 | 6091.51 | 7901.57 | 7097.92 | 7679.18 | 7948.82 | 7360.49 | 7209.07 | 7320.7 | 7698.29 | 9041.77 | 11050.22 | 11996.5 | 14203.3 | 15490.07 | |||||
| Imports of machinery and transport equipment | 8021.22 | 9969.16 | 10132.44 | 10027.87 | 8938.66 | 11032.67 | 13821.51 | 14000.15 | 14989.57 | 16115 | 15873.59 | 16020.15 | 15804.83 | 18557.24 | 19913.06 | 24121.56 | 26965.95 | 30677.13 | 34399.99 | |||||
| Imports of miscellaneous manufactured goods | 3252.66 | 3890.41 | 4244.35 | 4630.96 | 4182.53 | 4675.98 | 5495.78 | 5644.06 | 6626.88 | 6976.3 | 7127.16 | 6812.11 | 6955.09 | 7324.57 | 8725.54 | 9741.39 | 10713.57 | 12538.79 | 13750.01 | |||||
| Imports of other goods | 698.39 | 734.55 | 1383.27 | 1384.65 | 2230.65 | 2611.42 | 2969.24 | 3585.29 | 1558.54 | 1408.03 | 1228.35 | 1178.25 | 1551.65 | 1068.14 | 1023.36 | 1246.68 | 1142.74 | 1210.04 | 1288.14 | |||||
| Hungary | ||||||||||||||||||||||||
| 1989 | 1990 | 1991 | 1992 | 1993 | 1994 | 1995 | 1996 | 1997 | 1998 | 1999 | 2000 | 2001 | 2002 | 2003 | 2004 | 2005 | 2006 | 2007 | ||||||
| Exports of food and live animals | - | 1901.3 | 2258.1 | 2081.83 | 1415.37 | 1728.49 | 2256.91 | 2050.81 | 2195.15 | 2169.95 | 1825.5 | 1802.17 | 2145.96 | 2202.93 | 2650.98 | 3163.74 | 3356.22 | 3693.76 | 3963.81 | |||||
| Exports of beverages and tobacco | - | 129.1 | 93.2 | 143.9 | 188.76 | 192.03 | 258.75 | 323.62 | 224.75 | 202.22 | 150.75 | 102.99 | 101.65 | 109.17 | 138.3 | 155.65 | 144.62 | 187.08 | 191.71 | |||||
| Exports of crude materials exc. fuels | - | 455.2 | 632 | 556.05 | 494.5 | 523.27 | 595.81 | 573.3 | 523.64 | 500.66 | 483.58 | 562.06 | 527.58 | 613.19 | 768.83 | 1082.63 | 1086.32 | 1139.3 | 1177 | |||||
| Exports of mineral fuels | - | 296.3 | 298.1 | 326.41 | 307.67 | 367.59 | 383.8 | 427.06 | 432.8 | 424.47 | 397.54 | 453.21 | 483.73 | 510.42 | 689.96 | 1041.27 | 1619.58 | 1731.87 | 1797.13 | |||||
| Exports of oils and fats | - | 113 | 122.9 | 108.13 | 87.87 | 91.03 | 52.11 | 54.98 | 170.44 | 139.14 | 88.27 | 50.81 | 39.71 | 41.29 | 86.26 | 118.19 | 131.05 | 137.2 | 142.77 | |||||
| Exports of chemicals | - | 1191.2 | 1285.9 | 946.9 | 908.18 | 1048.58 | 1434.27 | 1312.1 | 1473.08 | 1466.48 | 1424.23 | 1709.09 | 1864.91 | 2118.06 | 2878.3 | 4118.42 | 4784.78 | 5739.08 | 6404.82 | |||||
| Exports of basic manufactures | - | 1769.8 | 1671.2 | 1594.61 | 1278.15 | 1591 | 2150.2 | 2265.96 | 2423.64 | 2741.83 | 2765.88 | 2945.37 | 3134.88 | 3471.27 | 4423.18 | 5626.33 | 6340.56 | 7070.57 | 7715.29 | |||||
| Exports of machinery and transport equipment | - | 2459 | 2255.3 | 2152.46 | 2004.86 | 2435.08 | 3247.64 | 3287.58 | 8575.9 | 11927.49 | 14283.64 | 16760.07 | 17509.78 | 20128.49 | 26260.55 | 34647 | 37180.61 | 44308.72 | 49003.66 | |||||
| Exports of miscellaneous manufactured goods | - | 1026 | 1560.3 | 2144.32 | 1549.06 | 1892.49 | 2068.84 | 2330.8 | 2560.38 | 3016.89 | 3232.43 | 3244.33 | 3899.04 | 4420.5 | 4547.6 | 5301.36 | 5528.27 | 5951.89 | 6295.29 | |||||
| Exports of other goods | - | 246.7 | 9.9 | 0.37 | 5.64 | 830.29 | 3.7 | 6.57 | 519.42 | 415.89 | 360.36 | 461.68 | 790.49 | 721.27 | 563.82 | 213.67 | 3068.56 | 4096.03 | 4581.32 | |||||
| 1989 | 1990 | 1991 | 1992 | 1993 | 1994 | 1995 | 1996 | 1997 | 1998 | 1999 | 2000 | 2001 | 2002 | 2003 | 2004 | 2005 | 2006 | 2007 | ||||||
| Imports of food and live animals | - | 548 | 543.66 | 511.03 | 618.09 | 811.66 | 716.17 | 690.05 | 772.63 | 832.99 | 730.99 | 800.04 | 881.47 | 1022.79 | 1330.5 | 2001.95 | 2192.75 | 2544.72 | 2813.91 | |||||
| Imports of beverages and tobacco | - | 69.5 | 84.06 | 80.51 | 55.78 | 92.2 | 79.01 | 99.64 | 103.43 | 101.21 | 101.15 | 67.81 | 76.18 | 86.69 | 120.48 | 218.39 | 184.8 | 338.19 | 395.05 | |||||
| Imports of crude materials exc. fuels | - | 454 | 620.11 | 411.15 | 359.55 | 526.72 | 612.58 | 575.06 | 542.95 | 563.47 | 522.24 | 625.44 | 550.83 | 638.05 | 852.5 | 1025.75 | 985.78 | 1073.34 | 1163.95 | |||||
| Imports of mineral fuels | - | 1229 | 1721.92 | 1662.57 | 1669.94 | 1715.96 | 1800.67 | 2194.14 | 1946.63 | 1616.14 | 1623.03 | 1508.33 | 1808.16 | 2771.57 | 2655.21 | 4357.54 | 4327.55 | 5716.48 | 6480.02 | |||||
| Imports of oils and fats | - | 8.9 | 14.2 | 10.38 | 15.33 | 18.08 | 41.13 | 42.86 | 99.28 | 118.54 | 45.4 | 47.74 | 52.41 | 63.87 | 80.14 | 88.51 | 94.53 | 86.62 | 89.25 | |||||
| Imports of chemicals | - | 1291.4 | 1419.65 | 1413.83 | 1474.84 | 1840.92 | 2195.83 | 2238.36 | 2404.57 | 2610.21 | 2664.43 | 2841.37 | 3004.84 | 3420.35 | 4596.74 | 5705.65 | 5849.27 | 6998.09 | 7719.94 | |||||
| Imports of basic manufactures | - | 1340.9 | 2170.94 | 2242.69 | 2269.81 | 2871.58 | 3538.03 | 3595.38 | 4186.8 | 4915.15 | 4956.67 | 5308.23 | 5476.57 | 6131.07 | 7648.67 | 9627.2 | 9127.04 | 10662.37 | 11770.04 | |||||
| Imports of machinery and transport equipment | - | 2992.3 | 3501.22 | 3201.17 | 3576.33 | 4505.49 | 4568.29 | 4889.95 | 8787.25 | 11892.36 | 13977.33 | 16366.12 | 17312.56 | 19406.01 | 24488.96 | 31890.49 | 32615.73 | 36684.22 | 39399.9 | |||||
| Imports of miscellaneous manufactured goods | - | 673.8 | 1294.73 | 1338.97 | 1335.82 | 1583.08 | 1633.85 | 1715.01 | 2072.81 | 2714.71 | 3050.67 | 3142.2 | 3186.72 | 3539.12 | 4494.4 | 5068.6 | 4829.25 | 5034.7 | 5241.2 | |||||
| Imports of other goods | - | 38.7 | 0.78 | 1.26 | 0.58 | 587.92 | 0 | 2.2 | 317.64 | 341.6 | 336.33 | 1372.18 | 1332.01 | 532.05 | 407.37 | 264.6 | 6534.63 | 7839.85 | 8840.05 | |||||
| Sources: | ||||||||||||||||||||||||
| 1 Imports (cif) of food and live animals, SITC classification 0: United Nations, UN Trade Statistics | ||||||||||||||||||||||||
| 2 Imports (cif) of beverages and tobacco, SITC classification 1: United Nations, UN Trade Statistics | ||||||||||||||||||||||||
| 3 Imports (cif) of crude materials exc. fuels, SITC classification 2: United Nations, UN Trade Statistics | ||||||||||||||||||||||||
| 4 Imports (cif) of mineral fuels, SITC classification 3: United Nations, UN Trade Statistics | ||||||||||||||||||||||||
| 5 Imports (cif) of oils and fats, SITC classification 4: United Nations, UN Trade Statistics | ||||||||||||||||||||||||
| 6 Imports (cif) of chemicals, SITC classification 5: United Nations, UN Trade Statistics | ||||||||||||||||||||||||
| 7 Imports (cif) of basic manufactures, SITC classification 6: United Nations, UN Trade Statistics | ||||||||||||||||||||||||
| 8 Imports (cif) of machinery and transport equipment, SITC classification 7: United Nations, UN Trade Statistics | ||||||||||||||||||||||||
| 9 Imports (cif) of miscellaneous manufactured goods, SITC classification 8: United Nations, UN Trade Statistics | ||||||||||||||||||||||||
| 10 Imports (cif) of other goods, SITC classification 9: United Nations, UN Trade Statistics | ||||||||||||||||||||||||
| 11 Exports (fob) of food and live animals, SITC classification 0: United Nations, UN Trade Statistics | ||||||||||||||||||||||||
| 12 Exports (fob) of beverages and tobacco, SITC classification 1: United Nations, UN Trade Statistics | ||||||||||||||||||||||||
| 13 Exports (fob) of crude materials exc. fuels, SITC classification 2: United Nations, UN Trade Statistics | ||||||||||||||||||||||||
| 14 Exports (fob) of mineral fuels, SITC classification 3: United Nations, UN Trade Statistics | ||||||||||||||||||||||||
| 15 Exports (fob) of oils and fats, SITC classification 4: United Nations, UN Trade Statistics | ||||||||||||||||||||||||
| 16 Exports (fob) of chemicals, SITC classification 5: United Nations, UN Trade Statistics | ||||||||||||||||||||||||
| 17 Exports (fob) of basic manufactures, SITC classification 6: United Nations, UN Trade Statistics | ||||||||||||||||||||||||
| 18 Exports (fob) of machinery and transport equipment, SITC classification 7: United Nations, UN Trade Statistics | ||||||||||||||||||||||||
| 19 Exports (fob) of miscellaneous manufactured goods, SITC classification 8: United Nations, UN Trade Statistics | ||||||||||||||||||||||||
| 20 Exports (fob) of other goods, SITC classification 9: United Nations, UN Trade Statistics |
Sheet1
Sheet2
Sheet3
_1258381501.xls
Chart1
| -41.01 |
| -50.83 |
| -52.04 |
| -39.9 |
| -8.62 |
| 18.31 |
| 18.1 |
| 18.45 |
| 18.19 |
| 17.97 |
| 17.91 |
| 17.87 |
| 17.57 |
| 17.26 |
| 16.79 |
| 16.66 |
| 9.69 |
| 3.54 |
| 15.56 |
| 18.16 |
| 17.27 |
| 14.2 |
| 14.17 |
Sheet1
| migration data from eurostat | ||||||||||||||||||||||||
| Hungary's migration | ||||||||||||||||||||||||
| 1985 | 1990 | 1995 | 2000 | 2005 | ||||||||||||||||||||
| International migration stock (% of population) | 3 | 3 | 3 | 3 | 3 | |||||||||||||||||||
| International migration stock, total | 339023 | 347510 | 293266 | 295990 | 316209 | |||||||||||||||||||
| Net migration | -65585 | -122622 | 100708 | 85000 | 65000 | |||||||||||||||||||
| denmark's migration | ||||||||||||||||||||||||
| 1985 | 1990 | 1995 | 2000 | 2005 | ||||||||||||||||||||
| International migration stock (% of population) | 4 | 4 | 5 | 6 | 7 | |||||||||||||||||||
| International migration stock, total | 190109 | 220193 | 249747 | 304249 | 388535 | |||||||||||||||||||
| Net migration | 9843 | 30114 | 58366 | 73469 | 45603 | |||||||||||||||||||
| total inflows of foreign population Dk-Hu | ||||||||||||||||||||||||
| 1995 | 1996 | 1997 | 1998 | 1999 | 2000 | 2001 | 2002 | 2003 | 2004 | 2005 | ||||||||||||||
| Denmark | 32.97 | 24.747 | 20.436 | 21.277 | 20.28 | 22.903 | 25.202 | 22.032 | 18.742 | 18.799 | .. | |||||||||||||
| Hungary | 14.008 | 13.734 | 13.283 | 16.052 | 20.151 | 20.184 | 20.308 | 17.972 | 19.365 | 22.164 | 18.809 | |||||||||||||
| total outflows of foreign population DK-HU | ||||||||||||||||||||||||
| 1995 | 1996 | 1997 | 1998 | 1999 | 2000 | 2001 | 2002 | 2003 | 2004 | 2005 | ||||||||||||||
| Denmark | 5.26 | 5.95 | 6.715 | 7.708 | 8.182 | 8.31 | 8.892 | 8.734 | 8.738 | 9.414 | .. | |||||||||||||
| Hungary | 2.401 | 2.833 | 1.928 | 2.343 | 2.46 | 2.208 | 1.944 | 2.388 | 2.553 | 3.466 | 3.846 | |||||||||||||
| data from oecd | ||||||||||||||||||||||||
| total migration HU | ||||||||||||||||||||||||
| 1995 | 1996 | 1997 | 1998 | 1999 | 2000 | 2001 | 2002 | 2003 | 2004 | 2005 | ||||||||||||||
| immigration | 14.008 | 13.734 | 13.283 | 16.052 | 20.151 | 20.184 | 20.308 | 17.972 | 19.365 | 22.164 | 18.809 | |||||||||||||
| otflow of foreign population | 2.401 | 2.833 | 1.928 | 2.343 | 2.46 | 2.208 | 1.944 | 2.388 | 2.553 | 3.466 | 3.846 | |||||||||||||
| total migration-DK | ||||||||||||||||||||||||
| 1995 | 1996 | 1997 | 1998 | 1999 | 2000 | 2001 | 2002 | 2003 | 2004 | 2005 | ||||||||||||||
| immigration | 32.97 | 24.747 | 20.436 | 21.277 | 20.28 | 22.903 | 25.202 | 22.032 | 18.742 | 18.799 | .. | |||||||||||||
| outflow of foreign population | 5.26 | 5.95 | 6.715 | 7.708 | 8.182 | 8.31 | 8.892 | 8.734 | 8.738 | 9.414 | .. | |||||||||||||
| immigration and emmigration in denmark (statbank) | ||||||||||||||||||||||||
| 1983 | 1984 | 1985 | 1986 | 1987 | 1988 | 1989 | 1990 | 1991 | 1992 | 1993 | 1994 | 1995 | 1996 | 1997 | 1998 | 1999 | 2000 | 2001 | 2002 | 2003 | 2004 | 2005 | 2006 | |
| Immigrated | 27718 | 29035 | 36214 | 38932 | 36296 | 35051 | 38391 | 40715 | 43567 | 43377 | 43400 | 44961 | 63187 | 54445 | 50105 | 51372 | 50236 | 52915 | 55984 | 52778 | 49754 | 49860 | 52458 | 56750 |
| Emigrated | 25999 | 25053 | 26715 | 27928 | 30123 | 34544 | 34949 | 32383 | 32629 | 31915 | 32344 | 34710 | 34630 | 37312 | 38393 | 40340 | 41340 | 43417 | 43980 | 43481 | 43466 | 45017 | 45869 | 46786 |
| danish immigration by continents | ||||||||||||||||||||||||
| 1983 | 1984 | 1985 | 1986 | 1987 | 1988 | 1989 | 1990 | 1991 | 1992 | 1993 | 1994 | 1995 | 1996 | 1997 | 1998 | 1999 | 2000 | 2001 | 2002 | 2003 | 2004 | 2005 | ||
| EU Countries | 4843 | 5098 | 6012 | 6217 | 5984 | 5560 | 5440 | 5819 | 6380 | 6363 | 7070 | 8179 | 7763 | 9192 | 9698 | 10314 | 9873 | 10616 | 11445 | 10537 | 10038 | 11203 | 13291 | |
| Europe (excl. EU Countries) | 2387 | 2811 | 3621 | 3925 | 4025 | 3881 | 3796 | 3719 | 4603 | 3881 | 3419 | 4008 | 21649 | 10431 | 6688 | 6031 | 5780 | 5937 | 6401 | 6383 | 5882 | 6161 | 6196 | |
| Africa | 516 | 753 | 824 | 979 | 1041 | 967 | 1184 | 1417 | 1844 | 1765 | 2385 | 2363 | 2606 | 3937 | 3082 | 2704 | 2234 | 2071 | 2141 | 1944 | 1619 | 1361 | 1016 | |
| North America | 1499 | 1644 | 1757 | 1855 | 1799 | 1727 | 1583 | 1800 | 1789 | 1648 | 1610 | 1451 | 1609 | 1591 | 1591 | 1698 | 1685 | 1725 | 1754 | 1815 | 1826 | 1986 | 2248 | |
| South and Central America | 271 | 287 | 264 | 313 | 405 | 434 | 466 | 575 | 682 | 558 | 557 | 542 | 578 | 608 | 686 | 726 | 856 | 850 | 790 | 805 | 648 | 643 | 685 | |
| Asia | 1962 | 2454 | 7292 | 8671 | 6401 | 5469 | 6270 | 5892 | 6201 | 6761 | 4952 | 3942 | 4410 | 5182 | 5171 | 6760 | 5620 | 7359 | 8385 | 7313 | 7008 | 5836 | 5769 | |
| danish immigrants by countries | ||||||||||||||||||||||||
| 1983 | 1984 | 1985 | 1986 | 1987 | 1988 | 1989 | 1990 | 1991 | 1992 | 1993 | 1994 | 1995 | 1996 | 1997 | 1998 | 1999 | 2000 | 2001 | 2002 | 2003 | 2004 | 2005 | ||
| Yugoslavia (former) | 209 | 299 | 435 | 511 | 587 | 610 | 604 | 666 | 803 | 552 | 272 | 215 | 650 | 2282 | 195 | 384 | 281 | 261 | 213 | 174 | 141 | 86 | 44 | |
| Poland | 218 | 311 | 1003 | 684 | 807 | 891 | 725 | 732 | 734 | 619 | 513 | 424 | 423 | 523 | 538 | 649 | 611 | 665 | 754 | 821 | 864 | 1157 | 1984 | |
| Turkey | 529 | 749 | 1417 | 1593 | 1790 | 1612 | 1405 | 1174 | 1915 | 1304 | 848 | 721 | 990 | 1402 | 1074 | 1287 | 1256 | 1183 | 1194 | 1116 | 502 | 488 | 426 | |
| Somalia | 10 | 13 | 18 | 23 | 48 | 79 | 198 | 195 | 578 | 699 | 1263 | 1034 | 1257 | 2010 | 1505 | 1005 | 568 | 421 | 449 | 478 | 394 | 215 | 119 | |
| Iraq | 19 | 91 | 480 | 385 | 221 | 442 | 504 | 408 | 433 | 1050 | 770 | 524 | 735 | 1015 | 954 | 1908 | 893 | 1369 | 1404 | 994 | 756 | 383 | 232 | |
| Iran | 54 | 627 | 3917 | 1134 | 1045 | 1000 | 652 | 707 | 779 | 552 | 393 | 270 | 233 | 356 | 336 | 355 | 311 | 556 | 662 | 457 | 319 | 228 | 214 | |
| Lebanon | 37 | 38 | 409 | 2448 | 1651 | 1104 | 1691 | 1347 | 1289 | 1339 | 537 | 271 | 234 | 257 | 242 | 324 | 248 | 357 | 261 | 248 | 111 | 129 | 88 | |
| Sri Lanka | 86 | 115 | 491 | 2369 | 1105 | 262 | 486 | 257 | 336 | 393 | 353 | 338 | 440 | 316 | 214 | 190 | 151 | 139 | 147 | 121 | 91 | 49 | 73 | |
| population, net migration in Hungary, DK | ||||||||||||||||||||||||
| Denmark | ||||||||||||||||||||||||
| 1985 | 1986 | 1987 | 1988 | 1989 | 1990 | 1991 | 1992 | 1993 | 1994 | 1995 | 1996 | 1997 | 1998 | 1999 | 2000 | 2001 | 2002 | 2003 | 2004 | 2005 | 2006 | 2007 | ||
| Foreign citizens, Denmark | - | - | - | - | - | 150.64 | 160.64 | 169.53 | 180.1 | 189.01 | 196.71 | 222.75 | 237.7 | 249.63 | 256.28 | 259.36 | 258.63 | 266.73 | 265.42 | 271.21 | 267.6 | 267.86 | - | |
| Net migration, Denmark | 9.79 | 11.31 | 6.38 | 0.66 | 3.68 | 8.55 | 10.88 | 11.58 | 11.47 | 10.51 | 28.67 | 17.5 | 11.99 | 11 | 9.38 | 10.09 | 12.02 | 9.61 | 7.03 | 4.96 | 6.73 | 9.96 | 5.47 | |
| Population, Denmark | 5111.11 | 5116.27 | 5124.79 | 5129.25 | 5129.78 | 5135.41 | 5146.47 | 5162.13 | 5180.61 | 5196.64 | 5215.72 | 5251.03 | 5275.12 | 5294.86 | 5313.58 | 5330.02 | 5349.21 | 5368.35 | 5383.51 | 5397.64 | 5411.41 | 5427.46 | 5446.93 | |
| Hungary | ||||||||||||||||||||||||
| 1985 | 1986 | 1987 | 1988 | 1989 | 1990 | 1991 | 1992 | 1993 | 1994 | 1995 | 1996 | 1997 | 1998 | 1999 | 2000 | 2001 | 2002 | 2003 | 2004 | 2005 | 2006 | 2007 | ||
| Foreign citizens, Hungary | - | - | - | - | - | 127.02 | 129.41 | 131.81 | 134.2 | 138 | 140 | 140 | 142.5 | 148.3 | 150.2 | 153.1 | 115.81 | 116.43 | 115.89 | 130.11 | 143.77 | 151.7 | - | |
| Net migration, Hungary | -41.01 | -50.83 | -52.04 | -39.9 | -8.62 | 18.31 | 18.1 | 18.45 | 18.19 | 17.97 | 17.91 | 17.87 | 17.57 | 17.26 | 16.79 | 16.66 | 9.69 | 3.54 | 15.56 | 18.16 | 17.27 | 14.2 | 14.17 | |
| Population, Hungary | 10657.42 | 10599 | 10529.28 | 10460.48 | 10404.83 | 10374.82 | 10373.15 | 10373.64 | 10365.04 | 10350.02 | 10336.7 | 10321.23 | 10301.24 | 10279.73 | 10253.42 | 10221.64 | 10200.3 | 10174.85 | 10142.36 | 10116.74 | 10097.55 | 10076.58 | 10057.88 | |
| Sources: | ||||||||||||||||||||||||
| 1 Population: national estimates at January 1st: Euromonitor International from national statistics/UN | ||||||||||||||||||||||||
| 2 Foreign citizens: Euromonitor International from trade sources/national statistics | ||||||||||||||||||||||||
| 3 Net migration: Euromonitor International from national statistical offices/UN | ||||||||||||||||||||||||
| exports, imports, trade balance | ||||||||||||||||||||||||
| Denmark | ||||||||||||||||||||||||
| 1985 | 1986 | 1987 | 1988 | 1989 | 1990 | 1991 | 1992 | 1993 | 1994 | 1995 | 1996 | 1997 | 1998 | 1999 | 2000 | 2001 | 2002 | 2003 | 2004 | 2005 | 2006 | |||
| Exports, Denmark | 17090.2 | 21285.6 | 25675.4 | 28502.4 | 29564.3 | 37037.2 | 37886.2 | 41675.7 | 38206.5 | 43120 | 51478.1 | 51479.9 | 49118.6 | 48839.2 | 50399.4 | 50380.2 | 51067.7 | 56303.5 | 65267 | 75619.9 | 83561.5 | 91710.3 | ||
| Imports, Denmark | 18245.3 | 22878.4 | 25498.6 | 27032.9 | 27801.4 | 33248.2 | 34057.2 | 35521.1 | 31330.6 | 36588.7 | 45728.1 | 45003.9 | 44406.3 | 46330.1 | 44519.3 | 44356 | 44123.8 | 48886.5 | 56216.5 | 66886.3 | 74258.9 | 85110.4 | ||
| Trade balance, Denmark | -1155.1 | -1592.8 | 176.8 | 1469.5 | 1762.9 | 3789 | 3829 | 6154.6 | 6875.9 | 6531.3 | 5750 | 6476 | 4712.3 | 2509.1 | 5880.1 | 6024.2 | 6943.9 | 7417 | 9050.5 | 8733.6 | 9302.6 | 6599.9 | ||
| Hungary | ||||||||||||||||||||||||
| 1985 | 1986 | 1987 | 1988 | 1989 | 1990 | 1991 | 1992 | 1993 | 1994 | 1995 | 1996 | 1997 | 1998 | 1999 | 2000 | 2001 | 2002 | 2003 | 2004 | 2005 | 2006 | |||
| Exports, Hungary | 8538.13 | 9165.43 | 9555.56 | 9949.37 | 10066.6 | 9597.78 | 10199.2 | 10663.5 | 8886.36 | 10434.2 | 12801.4 | 15631 | 18989.6 | 22991.6 | 24949.9 | 28015.9 | 30529.7 | 34511.6 | 42531.9 | 54892.3 | 62178.8 | 74216.4 | ||
| Imports, Hungary | 8223.68 | 9598.67 | 9841.47 | 9344.78 | 8709.07 | 8670.79 | 11417.3 | 11106.8 | 12468.4 | 14265.9 | 15379.5 | 18057.7 | 21115.4 | 25678.8 | 27922.8 | 31955.1 | 33724.5 | 37787.5 | 47601.6 | 59636.5 | 65783.3 | 77206.1 | ||
| Trade balance, Hungary | 314.45 | -433.24 | -285.91 | 604.59 | 1357.53 | 926.99 | -1218.1 | -443.3 | -3582.04 | -3831.7 | -2578.1 | -2426.7 | -2125.8 | -2687.2 | -2972.9 | -3939.2 | -3194.8 | -3275.9 | -5069.7 | -4744.2 | -3604.5 | -2989.7 | ||
| 1 Imports: Euromonitor International from International Monetary Fund (IMF), International Financial Statistics | ||||||||||||||||||||||||
| 2 Exports: Euromonitor International from International Monetary Fund (IMF), International Financial Statistics | ||||||||||||||||||||||||
| 3 Trade balance: Euromonitor International from International Monetary Fund (IMF), International Financial Statistics | ||||||||||||||||||||||||
| Hungary | 1985 | 1986 | 1987 | 1988 | 1989 | 1990 | 1991 | 1992 | 1993 | 1994 | 1995 | 1996 | 1997 | 1998 | 1999 | 2000 | 2001 | 2002 | 2003 | 2004 | 2005 | 2006 | 2007 | |
| Population, Hungary | 10657.42 | 10599 | 10,529 | 1,046,000 | 10404.83 | 10374.82 | 10373.15 | 10373.64 | 10365.04 | 10350.02 | 10336.7 | 10321.23 | 10301.24 | 10279.73 | 10253.42 | 10221.64 | 10200.3 | 10174.85 | 10142.36 | 10116.74 | 10097.55 | 10076.58 | 10057.88 | |
| Long term immigration by country and origin in Hungary | ||||||||||||||||||||||||
| 1987 | 1988 | 1989 | 1990 | 1991 | 1992 | 1993 | 1994 | 1995 | 1996 | Total | ||||||||||||||
| Romania | 2,064 | 17,779 | 26,592 | 29,617 | 10,940 | 6,489 | 6,068 | 4,242 | 4,701 | 3,812 | 112,334 | |||||||||||||
| Former Yugoslavia | 416 | 501 | 527 | 426 | 4,030 | 3,458 | 5,229 | 2,538 | 1,641 | 1,043 | 19,809 | |||||||||||||
| Former USSR | 912 | 1,035 | 1,002 | 1,586 | 1,961 | 1,667 | 1,665 | 1,869 | 1,769 | 1,917 | 15,383 | |||||||||||||
| Other Central and Easterm Europe | 1,794 | 1,413 | 1,606 | 1,160 | 490 | 500 | 423 | 499 | 601 | 513 | 8,383 | |||||||||||||
| European Union | 812 | 813 | 1,336 | 1,343 | 1,397 | 1,046 | 1,031 | 1,347 | 1,305 | 1,357 | 11,787 | |||||||||||||
| Other OECD | 194 | 273 | 357 | 805 | 853 | 650 | 573 | 785 | 897 | 890 | 6,277 | |||||||||||||
| Other | 2,126 | 1,665 | 2,313 | 2,305 | 3,303 | 1,303 | 1,408 | 1,442 | 2,271 | 3,006 | 21,142 | |||||||||||||
| Total | 8,318 | 23,479 | 33,733 | 37,242 | 22,974 | 15,113 | 16,397 | 12,752 | 13,185 | 12,537 | 195,730 | |||||||||||||
| Romania | 19.6024799416 | 1.6997131931 | ||||||||||||||||||||||
| Former Yugoslavia | 3.9508874301 | 0.0478967495 | ||||||||||||||||||||||
| Former USSR | 8.6615609044 | 0.0989483748 | ||||||||||||||||||||||
| Other Central and Easterm Europe | 17.0382020423 | 0.1350860421 | ||||||||||||||||||||||
| European Union | 7.7118283491 | 0.0777246654 | ||||||||||||||||||||||
| Other OECD | 1.8424811573 | 0.0260994264 | ||||||||||||||||||||||
| Other | 20.1913141259 | 0.1591778203 | ||||||||||||||||||||||
| Total | 78.9987539509 | 2.2446462715 | ||||||||||||||||||||||
| Source: Register of foreign nationals with long-terme residence permits in Hungary, Ministry of the Interior | ||||||||||||||||||||||||
| 1985 | 1986 | 1987 | 1988 | 1989 | 1990 | 1991 | 1992 | 1993 | 1994 | 1995 | 1996 | 1997 | 1998 | 1999 | 2000 | 2001 | 2002 | 2003 | 2004 | 2005 | 2006 | 2007 | ||
| Denmark | ||||||||||||||||||||||||
| 16548.53 | 20309.82 | 24422.14 | 26297.79 | 26929.39 | 33322.93 | 35899.17 | 41630.48 | 37619.8 | 42124.7 | 50388.43 | 50770.24 | 52648.49 | 52477.98 | 54440.82 | 55578.97 | 56172.04 | 61717.5 | 72761.77 | 83881.22 | 95725.13 | 107209.12 | - | ||
| - | - | - | - | 28046.2 | 34842.8 | 35713.06 | 39553.11 | 37170.99 | 41602.37 | 48789.13 | 48884.54 | 48800.43 | 47709.99 | 49027.81 | 49210.3 | 50977.56 | 55685.47 | 64613.99 | 74792.64 | 82415.35 | 90118.24 | 95222.66 | ||
| 17468.74 | 21851.59 | 24255.99 | 25136.31 | 25085.39 | 30433.99 | 31144.51 | 34819.43 | 30109.73 | 35095.09 | 43679.54 | 42532.84 | 46219.28 | 48174.57 | 48855.06 | 49898.28 | 49601.1 | 54200.42 | 62898.42 | 74660.6 | 85286.62 | 99492.54 | 110598.12 | ||
| - | - | - | - | 26618.14 | 31575.71 | 32169.42 | 33590.32 | 30535.71 | 35436.45 | 43141.53 | 43126.35 | 44492.34 | 45700.68 | 44316.61 | 44586.86 | 44631.17 | 49312.59 | 56230.43 | 66895.19 | 74265.07 | 84510.99 | 92917.65 | ||
| Hungary | ||||||||||||||||||||||||
| 5798.4 | 6431.9 | 6584.76 | 7361.61 | 6953.34 | 7398.89 | 9003.3 | 9431.9 | 7633 | 13149.6 | 16562.7 | 17324.82 | 24676.81 | 29526.43 | 30888.29 | 35177 | 38697.72 | 43444.85 | 55806.88 | 76422.63 | 91268.13 | 114996.49 | - | ||
| - | - | - | - | - | 9587.6 | 10186.9 | 10054.98 | 8240.06 | 10699.84 | 12452.02 | 12632.79 | 19099.19 | 23005.02 | 25012.19 | 28091.79 | 30497.74 | 34336.58 | 43007.78 | 55468.25 | 63240.57 | 74055.48 | 81272.78 | ||
| 6187.4 | 7138.98 | 7321.53 | 7307.9 | 6680.16 | 7093.43 | 9231.8 | 8619.7 | 9380.5 | 17210.3 | 18583 | 20029.38 | 26039.22 | 30927.84 | 33635.29 | 38989.2 | 41158.4 | 46540.5 | 60306.43 | 78658 | 89823.66 | 109767.26 | 120710.86 | ||
| - | - | - | - | - | 8646.5 | 11371.26 | 10873.58 | 11376.08 | 14553.61 | 15185.56 | 16042.64 | 21234.01 | 25706.39 | 28008.23 | 32079.45 | 33681.74 | 37611.57 | 46674.97 | 60248.67 | 66741.34 | 76978.58 | 83913.31 | ||
| Sources: | ||||||||||||||||||||||||
| 1 Foreign trade: Euromonitor International from trade sources/national statistics | ||||||||||||||||||||||||
| 2 Imports (cif) by origin: International Monetary Fund (IMF), Direction of Trade Statistics | ||||||||||||||||||||||||
| 3 Imports (cif) by commodity: United Nations, UN Trade Statistics | ||||||||||||||||||||||||
| 4 Exports (fob) by destination: International Monetary Fund (IMF), Direction of Trade Statistics | ||||||||||||||||||||||||
| 5 Exports (fob) by commodity: United Nations, UN Trade Statistics | ||||||||||||||||||||||||
| exports,imports by origin | ||||||||||||||||||||||||
| Denmark | ||||||||||||||||||||||||
| 1985 | 1986 | 1987 | 1988 | 1989 | 1990 | 1991 | 1992 | 1993 | 1994 | 1995 | 1996 | 1997 | 1998 | 1999 | 2000 | 2001 | 2002 | 2003 | 2004 | 2005 | 2006 | 2007 | ||
| Exports to Africa and the Middle East | 946.76 | 930.35 | 964.08 | 1170.47 | 1153.56 | 1650.44 | 1155.08 | 1686.62 | 1361.95 | 1634.94 | 1827.09 | 1407.98 | 1392.17 | 1410.42 | 1426.83 | 1332.85 | 1459.3 | 1639.89 | 1918.11 | 2119.83 | 2149.46 | 2002.33 | 2502.64 | |
| Exports to Asia-Pacific | 1055.57 | 1360.3 | 1863.53 | 2049.33 | 1969.42 | 2201.44 | 2350.54 | 2941.31 | 2868.25 | 3432.65 | 4304.39 | 4242.44 | 3897.13 | 3358.1 | 3692.14 | 3785.11 | 3855.94 | 4044.87 | 4916.76 | 5799.17 | 5925.29 | 6215.58 | 6257.59 | |
| Exports to Australasia | 143.16 | 141.92 | 162.89 | 183.35 | 213.15 | 195.66 | 182.6 | 212.89 | 229.78 | 282.5 | 317.66 | 331.2 | 339.31 | 326.85 | 371.68 | 368.58 | 358.91 | 426.7 | 565.37 | 823.29 | 751.11 | 855.18 | 1065.24 | |
| Exports to Europe, Denmark | 12120.82 | 15564.74 | 19129.26 | 20764.77 | 21475.94 | 27042.29 | 29839.11 | 33868.39 | 30340.04 | 33540.61 | 40812.41 | 41686.27 | 43736.32 | 44043.69 | 45220.04 | 45971.86 | 45871.88 | 50840.67 | 59964.08 | 69299.09 | 79726.2 | 90178.61 | 95408.43 | |
| Exports to EU-27, Denmark | 10011.43 | 12774 | 15816.75 | 17325.11 | 18221.29 | 22984.67 | 24352.63 | 27725.63 | 23572.72 | 25679.63 | 31307.92 | 31135.23 | 32839.48 | 32797.06 | 34490.85 | 36012.3 | 34961.19 | 38539.13 | 45475.03 | 52937.48 | 59639.18 | 65669.69 | 68871.65 | |
| Exports to Latin America | 360.12 | 336.91 | 292.83 | 348.5 | 361.96 | 352.46 | 615.55 | 852.88 | 740.72 | 835.92 | 952.35 | 862.75 | 824.94 | 799.31 | 720.11 | 791.5 | 734.78 | 763.61 | 762.39 | 895.23 | 982.31 | 1250.42 | 1198.89 | |
| Exports to USA | 1753.8 | 1796.25 | 1806.36 | 1589.21 | 1552.04 | 1700.2 | 1577.55 | 1882.94 | 1897.57 | 2185.27 | 1979.25 | 2032.93 | 2234.33 | 2263.84 | 2709.42 | 2994.22 | 3524.58 | 3569.16 | 4078.41 | 4379.78 | 5458.85 | 5778.21 | 7019.2 | |
| 1985 | 1986 | 1987 | 1988 | 1989 | 1990 | 1991 | 1992 | 1993 | 1994 | 1995 | 1996 | 1997 | 1998 | 1999 | 2000 | 2001 | 2002 | 2003 | 2004 | 2005 | 2006 | 2007 | ||
| Imports from Africa and the Middle East | 701.94 | 577.12 | 517.13 | 568.24 | 718.88 | 615.04 | 226.46 | 221.98 | 324.54 | 401.62 | 435.38 | 438.62 | 385.71 | 385.11 | 281.38 | 383.64 | 449.69 | 376.82 | 445.32 | 1032.44 | 1240.12 | 1018.84 | 741.62 | |
| Imports from Asia-Pacific | 1246.66 | 2023.24 | 2103.01 | 2230.99 | 2238.07 | 2735.05 | 2948.4 | 2870.83 | 2800.51 | 3365.31 | 3420.88 | 3321.99 | 3345.14 | 3521.7 | 3620.7 | 3803.75 | 3574.76 | 3765.01 | 5198.57 | 6528.32 | 7486.15 | 8507.46 | 9641.41 | |
| Imports from Australasia | 126.59 | 130.28 | 164.18 | 94.39 | 101.92 | 92.7 | 121.77 | 111.27 | 64.51 | 85.5 | 114.08 | 134.48 | 129.49 | 185.93 | 100.04 | 95.13 | 108.56 | 121.54 | 206.25 | 298.95 | 297.13 | 293.44 | 290.29 | |
| Imports from Europe, Denmark | 13719.41 | 17337.03 | 19541.31 | 20037.58 | 19482.56 | 24231.42 | 25068.33 | 28888.68 | 24732.42 | 28681.94 | 36807.26 | 35597.87 | 39090.2 | 40876.14 | 41966.32 | 42698.88 | 42503.87 | 47142.27 | 54190.53 | 63259.35 | 72745.07 | 85573.88 | 95170.63 | |
| Imports from EU-27 , Denmark | 11847.93 | 15119.29 | 16938 | 17251.97 | 16886.96 | 20723.34 | 21089.22 | 23810.06 | 19570.64 | 22465.24 | 29339.85 | 28056.12 | 31312.98 | 32597.66 | 33689.77 | 32917 | 32831.36 | 36936.74 | 42047.36 | 48508.5 | 53582.15 | 62099.2 | 68865.4 | |
| Imports from Latin America | 525.76 | 488.94 | 479.93 | 523.36 | 627.85 | 668.73 | 606.86 | 642.41 | 640.59 | 671.47 | 691.43 | 770.68 | 854.58 | 732.93 | 639.91 | 684.86 | 738.97 | 655.62 | 844.78 | 1046.61 | 1179.47 | 1225.86 | 1441.91 | |
| Imports from USA | 1074.85 | 1207.29 | 1350.91 | 1563.03 | 1778.96 | 1949.73 | 2011.93 | 1868.93 | 1417.15 | 1741.5 | 2058.38 | 2105.72 | 2242.96 | 2308.76 | 2018.14 | 1939.78 | 1964.76 | 1910.47 | 1827.72 | 2265.09 | 2064.45 | 2563.35 | 2650.81 | |
| Hungary | ||||||||||||||||||||||||
| 1985 | 1986 | 1987 | 1988 | 1989 | 1990 | 1991 | 1992 | 1993 | 1994 | 1995 | 1996 | 1997 | 1998 | 1999 | 2000 | 2001 | 2002 | 2003 | 2004 | 2005 | 2006 | 2007 | ||
| Exports to Africa and the Middle East | 685.78 | 470.92 | 452.91 | 539.66 | 441.29 | 416.32 | 483.9 | 337.8 | 258.8 | 204.3 | 385.4 | 318.2 | 312.09 | 321.13 | 260.75 | 306.2 | 380.03 | 579.28 | 1060.63 | 1376.06 | 1987.79 | 2496.7 | 2612.63 | |
| Exports to Asia-Pacific | 231.69 | 336.64 | 345 | 542.42 | 469.65 | 471.18 | 415.2 | 270.6 | 287.2 | 245 | 249.1 | 314.53 | 368.67 | 432.51 | 583.02 | 667.9 | 729.08 | 863.9 | 864.72 | 1262.16 | 1590.17 | 2395.77 | 2610.18 | |
| Exports to Australasia | 5.94 | 10.46 | 13.73 | 25.53 | 22.28 | 19.03 | 21.9 | 20.2 | 20.1 | 22 | 22.7 | 23.17 | 23.36 | 24.25 | 27.67 | 29.1 | 26.83 | 105.48 | 57.02 | 78.31 | 102.29 | 140.11 | 151.89 | |
| Exports to Europe, Hungary | 4528.43 | 5238.41 | 5340.3 | 5821.99 | 5558.88 | 6049.16 | 7627.7 | 8363.4 | 6626.8 | 12164.6 | 15417.3 | 16111.21 | 23239.31 | 27464.48 | 28530.58 | 32501.9 | 35858.59 | 40467.38 | 52247.7 | 71725.54 | 85301.03 | 107427.79 | 123281.3 | |
| Exports to EU-27, Hungary | 2499.69 | 2850.56 | 3150.48 | 3575.78 | 3691.71 | 4611.4 | 6188.2 | 6798.8 | 5198.1 | 7649.6 | 9295.3 | 9537.49 | 15468.55 | 18979.6 | 20976.69 | 23506.1 | 25298.73 | 28671.01 | 35698.04 | 46004.05 | 50838.35 | 59682.07 | 67571.99 | |
| Exports to Latin America | 119.4 | 121.8 | 104.11 | 93.81 | 106.52 | 74.75 | 100.4 | 48.5 | 41.7 | 48.1 | 53.5 | 70.75 | 77.34 | 175.98 | 154.25 | 157.8 | 164.97 | 184.92 | 169.49 | 262.04 | 306.19 | 348.06 | 341.86 | |
| Exports to USA | 197.08 | 214.4 | 286.96 | 293.63 | 318.71 | 339.53 | 322.5 | 343 | 373.5 | 430.5 | 413.1 | 464.33 | 618.62 | 1045.28 | 1298.67 | 1475 | 1495.25 | 1180.83 | 1342.31 | 1649.49 | 1892.89 | 2048.41 | 1843.46 | |
| 1985 | 1986 | 1987 | 1988 | 1989 | 1990 | 1991 | 1992 | 1993 | 1994 | 1995 | 1996 | 1997 | 1998 | 1999 | 2000 | 2001 | 2002 | 2003 | 2004 | 2005 | 2006 | 2007 | ||
| Imports from Africa and the Middle East | 183.48 | 113.18 | 181.83 | 154.71 | 71.55 | 345.92 | 370.4 | 49.5 | 50.4 | 83.2 | 141.9 | 203.97 | 177.88 | 201.24 | 196.14 | 200.1 | 236.07 | 207.38 | 227.47 | 141.69 | 174.8 | 180.83 | 284.62 | |
| Imports from Asia-Pacific | 323.96 | 506.75 | 544.53 | 522.94 | 464.8 | 488.09 | 637.6 | 494.9 | 657.3 | 783.5 | 841.3 | 1038.56 | 1919.81 | 2791.53 | 3293.7 | 4807.9 | 5156.75 | 6592.94 | 8676.99 | 8092.44 | 10365.59 | 11347.47 | 12252.41 | |
| Imports from Australasia | 31.56 | 14.82 | 13.23 | 19.71 | 12.82 | 8.61 | 371.2 | 7.5 | 5.6 | 5.2 | 6.6 | 14.41 | 18.08 | 27.26 | 20.28 | 25.4 | 32.17 | 24.93 | 45.67 | 36.78 | 20.89 | 17.94 | 39.53 | |
| Imports from Europe, Hungary | 5160.33 | 6096.77 | 6133.86 | 6105.05 | 5679.02 | 5796.14 | 7347.2 | 7541.9 | 7964.2 | 15658.6 | 16845.7 | 17909.72 | 22719.36 | 26392.14 | 28653.75 | 32232.9 | 33854.66 | 37798.42 | 49155.56 | 69073.59 | 77695.01 | 96719.45 | 106430.93 | |
| Imports from EU-27, Hungary | 3006.43 | 3554.95 | 3742.55 | 3778.36 | 3837.83 | 4425.68 | 6028.5 | 6350.6 | 6774.8 | 9714.6 | 10372 | 10714.35 | 14897.64 | 18307.48 | 20018.74 | 21226.2 | 22102.44 | 24241.35 | 30678.81 | 43620.6 | 46434.01 | 55031.83 | 60937.03 | |
| Imports from Latin America | 218.61 | 200.01 | 182.61 | 285.47 | 222.49 | 216.28 | 184.8 | 165 | 169.5 | 194.1 | 223.8 | 246.69 | 318 | 416.87 | 442.87 | 422.8 | 400.47 | 442.79 | 548.53 | 240.9 | 331.82 | 282.2 | 257.84 | |
| Imports from USA | 244.98 | 194.24 | 251.26 | 210.01 | 221.8 | 227.94 | 299.4 | 322.7 | 500.4 | 451.7 | 481.7 | 568.89 | 797.73 | 992.82 | 965.07 | 1223.7 | 1410.18 | 1373.19 | 1524.1 | 988.66 | 1095.37 | 1105.18 | 1312.54 | |
| Sources: | ||||||||||||||||||||||||
| 1 Imports (cif) from Asia-Pacific: International Monetary Fund (IMF), Direction of Trade Statistics | ||||||||||||||||||||||||
| 2 Imports (cif) from USA: International Monetary Fund (IMF), Direction of Trade Statistics | ||||||||||||||||||||||||
| 3 Exports (fob) to Asia-Pacific: International Monetary Fund (IMF), Direction of Trade Statistics | ||||||||||||||||||||||||
| 4 Exports (fob) to USA: International Monetary Fund (IMF), Direction of Trade Statistics | ||||||||||||||||||||||||
| 5 Exports (fob) to Latin America: Euromonitor International from trade sources/national statistics | ||||||||||||||||||||||||
| 6 Imports (cif) from Latin America: Euromonitor International from trade sources/national statistics | ||||||||||||||||||||||||
| 7 Imports (cif) from Europe: Euromonitor International from trade sources/national statistics | ||||||||||||||||||||||||
| 8 Exports (fob) to Europe: Euromonitor International from trade sources/national statistics | ||||||||||||||||||||||||
| 9 Imports (cif) from Australasia: Euromonitor International from trade sources/national statistics | ||||||||||||||||||||||||
| 10 Exports (fob) to Australasia: Euromonitor International from trade sources/national statistics | ||||||||||||||||||||||||
| 11 Exports (fob) to Africa and the Middle East: Euromonitor International from trade sources/national statistics | ||||||||||||||||||||||||
| 12 Imports (cif) from Africa and the Middle East: Euromonitor International from trade sources/national statistics | ||||||||||||||||||||||||
| 13 Imports (cif) from EU-27: Euromonitor International from trade sources/national statistics | ||||||||||||||||||||||||
| 14 Exports (fob) to EU-27: Euromonitor International from trade sources/national statistics | ||||||||||||||||||||||||
| exports, imports by commodity | ||||||||||||||||||||||||
| Denmark | ||||||||||||||||||||||||
| 1989 | 1990 | 1991 | 1992 | 1993 | 1994 | 1995 | 1996 | 1997 | 1998 | 1999 | 2000 | 2001 | 2002 | 2003 | 2004 | 2005 | 2006 | 2007 | ||||||
| Exports of food and live animals | 7200.95 | 8721.86 | 9070.13 | 9683.81 | 8980.06 | 9803.91 | 10867.2 | 10455.51 | 10632.09 | 9992.92 | 9455.12 | 8963.19 | 9592.5 | 9943.41 | 11348 | 12658.8 | 13190.44 | 14542.7 | 15013.02 | |||||
| Exports of beverages and tobacco | 288.91 | 369.2 | 390.33 | 422.76 | 412.03 | 430.59 | 539.46 | 483.66 | 492.12 | 479.83 | 470.76 | 545.23 | 475.19 | 614.87 | 821.56 | 874.91 | 880.33 | 965.79 | 989.35 | |||||
| Exports of crude materials exc. fuels | 1511.47 | 1636.85 | 1544.71 | 1538.25 | 1292.71 | 1460.76 | 1760.43 | 1779.35 | 1776.86 | 1598.52 | 1502.94 | 1490.19 | 1571.8 | 1902.65 | 2297.19 | 2712.96 | 2745.1 | 3289.39 | 3569.5 | |||||
| Exports of mineral fuels | 843.95 | 1163.87 | 1287.91 | 1356.07 | 1095.3 | 1033.55 | 1260.46 | 2097.24 | 1827.83 | 1310.49 | 1846.62 | 3450.36 | 2917.97 | 3441.58 | 4234.03 | 5869.14 | 7751.65 | 9237.32 | 10563.68 | |||||
| Exports of oils and fats | 133.06 | 151.5 | 146.93 | 165.96 | 139.79 | 189.22 | 278.79 | 264.11 | 278.71 | 263.62 | 232.01 | 181.76 | 191.87 | 223.02 | 272.06 | 366.89 | 418.78 | 478.23 | 521.07 | |||||
| Exports of chemicals | 2466.72 | 2951.75 | 2997.33 | 3571.56 | 3386.17 | 3807.33 | 4725.03 | 4691.39 | 5007.01 | 4788.7 | 5405.76 | 5378.63 | 6080.82 | 6809.58 | 8548.54 | 9623.99 | 10850.25 | 10964.25 | 11093.15 | |||||
| Exports of basic manufactures | 3102.16 | 3863.75 | 3876.41 | 4227.63 | 3691.52 | 4137.32 | 5256.56 | 5028.82 | 5265.22 | 5291.12 | 5421.68 | 5161.9 | 5145.62 | 5526.11 | 6471.07 | 7408.41 | 7824.54 | 9152.66 | 9769.61 | |||||
| Exports of machinery and transport equipment | 7033.82 | 9196.7 | 9029.22 | 10447.73 | 8981.59 | 10267.63 | 12260 | 12490 | 13158.32 | 13184.6 | 13682.95 | 13027.43 | 13983.45 | 16356.54 | 17829.6 | 20658.27 | 23176.97 | 24871.01 | 26412.85 | |||||
| Exports of miscellaneous manufactured goods | 4029.24 | 5122.99 | 5495.67 | 6138.08 | 5587.75 | 6089.86 | 7192.77 | 7020.28 | 7610.95 | 7953.47 | 8186.57 | 8266.84 | 8248.24 | 8660.25 | 10371.73 | 11872.98 | 12461.16 | 13815.02 | 14449.52 | |||||
| Exports of other goods | 1435.92 | 1664.34 | 1874.42 | 2001.26 | 3604.07 | 4382.2 | 4648.42 | 4574.18 | 2751.32 | 2846.73 | 2823.41 | 2744.75 | 2770.09 | 2207.46 | 2420.21 | 2746.29 | 3116.13 | 2801.86 | 2840.91 | |||||
| 1989 | 1990 | 1991 | 1992 | 1993 | 1994 | 1995 | 1996 | 1997 | 1998 | 1999 | 2000 | 2001 | 2002 | 2003 | 2004 | 2005 | 2006 | 2007 | ||||||
| Imports of food and live animals | 2798.28 | 3215.57 | 3420.19 | 3750.91 | 3471.02 | 3729.09 | 4310.89 | 4383.43 | 4587.06 | 4593.55 | 4440.47 | 4222.63 | 4276.3 | 4749.94 | 5654.87 | 6495.11 | 6963.06 | 7780.22 | 8400.01 | |||||
| Imports of beverages and tobacco | 305.21 | 374.71 | 387.58 | 438.29 | 432.56 | 451.79 | 546.4 | 574.35 | 696.92 | 635.87 | 647.34 | 588.83 | 599.84 | 678.56 | 830.96 | 926.03 | 941.07 | 1034.05 | 1113.04 | |||||
| Imports of crude materials exc. fuels | 1167.22 | 1238.93 | 1133.85 | 1231.34 | 1052.96 | 1345.09 | 1609.4 | 1478.74 | 1693.53 | 1692.57 | 1555.88 | 1466.47 | 1490.22 | 1589.2 | 1902.72 | 2064.78 | 2020.98 | 2456.58 | 2685.42 | |||||
| Imports of mineral fuels | 1922.46 | 2203.22 | 1694.27 | 1596.23 | 1534.07 | 1469.1 | 1436.07 | 1648.89 | 1700.64 | 1301.8 | 1361.98 | 2522.51 | 1826.47 | 2166.49 | 2656.49 | 3565.85 | 5009.25 | 4983.65 | 5259.96 | |||||
| Imports of oils and fats | 149.53 | 152.06 | 149.04 | 187.49 | 163.81 | 188.05 | 229.34 | 246.87 | 266.16 | 302.83 | 220.71 | 182.73 | 208.07 | 234.53 | 287.21 | 365.5 | 415.87 | 508.48 | 550.97 | |||||
| Imports of chemicals | 3013.89 | 3609.71 | 3572.03 | 3875.41 | 3394.21 | 3841.75 | 4821.33 | 4466.65 | 4693.86 | 4725.92 | 4500.65 | 4384.11 | 4598.01 | 5245.64 | 6194.44 | 7318.08 | 8096.08 | 9118.75 | 9980.04 | |||||
| Imports of basic manufactures | 5289.27 | 6187.39 | 6052.39 | 6467.16 | 5135.23 | 6091.51 | 7901.57 | 7097.92 | 7679.18 | 7948.82 | 7360.49 | 7209.07 | 7320.7 | 7698.29 | 9041.77 | 11050.22 | 11996.5 | 14203.3 | 15490.07 | |||||
| Imports of machinery and transport equipment | 8021.22 | 9969.16 | 10132.44 | 10027.87 | 8938.66 | 11032.67 | 13821.51 | 14000.15 | 14989.57 | 16115 | 15873.59 | 16020.15 | 15804.83 | 18557.24 | 19913.06 | 24121.56 | 26965.95 | 30677.13 | 34399.99 | |||||
| Imports of miscellaneous manufactured goods | 3252.66 | 3890.41 | 4244.35 | 4630.96 | 4182.53 | 4675.98 | 5495.78 | 5644.06 | 6626.88 | 6976.3 | 7127.16 | 6812.11 | 6955.09 | 7324.57 | 8725.54 | 9741.39 | 10713.57 | 12538.79 | 13750.01 | |||||
| Imports of other goods | 698.39 | 734.55 | 1383.27 | 1384.65 | 2230.65 | 2611.42 | 2969.24 | 3585.29 | 1558.54 | 1408.03 | 1228.35 | 1178.25 | 1551.65 | 1068.14 | 1023.36 | 1246.68 | 1142.74 | 1210.04 | 1288.14 | |||||
| Hungary | ||||||||||||||||||||||||
| 1989 | 1990 | 1991 | 1992 | 1993 | 1994 | 1995 | 1996 | 1997 | 1998 | 1999 | 2000 | 2001 | 2002 | 2003 | 2004 | 2005 | 2006 | 2007 | ||||||
| Exports of food and live animals | - | 1901.3 | 2258.1 | 2081.83 | 1415.37 | 1728.49 | 2256.91 | 2050.81 | 2195.15 | 2169.95 | 1825.5 | 1802.17 | 2145.96 | 2202.93 | 2650.98 | 3163.74 | 3356.22 | 3693.76 | 3963.81 | |||||
| Exports of beverages and tobacco | - | 129.1 | 93.2 | 143.9 | 188.76 | 192.03 | 258.75 | 323.62 | 224.75 | 202.22 | 150.75 | 102.99 | 101.65 | 109.17 | 138.3 | 155.65 | 144.62 | 187.08 | 191.71 | |||||
| Exports of crude materials exc. fuels | - | 455.2 | 632 | 556.05 | 494.5 | 523.27 | 595.81 | 573.3 | 523.64 | 500.66 | 483.58 | 562.06 | 527.58 | 613.19 | 768.83 | 1082.63 | 1086.32 | 1139.3 | 1177 | |||||
| Exports of mineral fuels | - | 296.3 | 298.1 | 326.41 | 307.67 | 367.59 | 383.8 | 427.06 | 432.8 | 424.47 | 397.54 | 453.21 | 483.73 | 510.42 | 689.96 | 1041.27 | 1619.58 | 1731.87 | 1797.13 | |||||
| Exports of oils and fats | - | 113 | 122.9 | 108.13 | 87.87 | 91.03 | 52.11 | 54.98 | 170.44 | 139.14 | 88.27 | 50.81 | 39.71 | 41.29 | 86.26 | 118.19 | 131.05 | 137.2 | 142.77 | |||||
| Exports of chemicals | - | 1191.2 | 1285.9 | 946.9 | 908.18 | 1048.58 | 1434.27 | 1312.1 | 1473.08 | 1466.48 | 1424.23 | 1709.09 | 1864.91 | 2118.06 | 2878.3 | 4118.42 | 4784.78 | 5739.08 | 6404.82 | |||||
| Exports of basic manufactures | - | 1769.8 | 1671.2 | 1594.61 | 1278.15 | 1591 | 2150.2 | 2265.96 | 2423.64 | 2741.83 | 2765.88 | 2945.37 | 3134.88 | 3471.27 | 4423.18 | 5626.33 | 6340.56 | 7070.57 | 7715.29 | |||||
| Exports of machinery and transport equipment | - | 2459 | 2255.3 | 2152.46 | 2004.86 | 2435.08 | 3247.64 | 3287.58 | 8575.9 | 11927.49 | 14283.64 | 16760.07 | 17509.78 | 20128.49 | 26260.55 | 34647 | 37180.61 | 44308.72 | 49003.66 | |||||
| Exports of miscellaneous manufactured goods | - | 1026 | 1560.3 | 2144.32 | 1549.06 | 1892.49 | 2068.84 | 2330.8 | 2560.38 | 3016.89 | 3232.43 | 3244.33 | 3899.04 | 4420.5 | 4547.6 | 5301.36 | 5528.27 | 5951.89 | 6295.29 | |||||
| Exports of other goods | - | 246.7 | 9.9 | 0.37 | 5.64 | 830.29 | 3.7 | 6.57 | 519.42 | 415.89 | 360.36 | 461.68 | 790.49 | 721.27 | 563.82 | 213.67 | 3068.56 | 4096.03 | 4581.32 | |||||
| 1989 | 1990 | 1991 | 1992 | 1993 | 1994 | 1995 | 1996 | 1997 | 1998 | 1999 | 2000 | 2001 | 2002 | 2003 | 2004 | 2005 | 2006 | 2007 | ||||||
| Imports of food and live animals | - | 548 | 543.66 | 511.03 | 618.09 | 811.66 | 716.17 | 690.05 | 772.63 | 832.99 | 730.99 | 800.04 | 881.47 | 1022.79 | 1330.5 | 2001.95 | 2192.75 | 2544.72 | 2813.91 | |||||
| Imports of beverages and tobacco | - | 69.5 | 84.06 | 80.51 | 55.78 | 92.2 | 79.01 | 99.64 | 103.43 | 101.21 | 101.15 | 67.81 | 76.18 | 86.69 | 120.48 | 218.39 | 184.8 | 338.19 | 395.05 | |||||
| Imports of crude materials exc. fuels | - | 454 | 620.11 | 411.15 | 359.55 | 526.72 | 612.58 | 575.06 | 542.95 | 563.47 | 522.24 | 625.44 | 550.83 | 638.05 | 852.5 | 1025.75 | 985.78 | 1073.34 | 1163.95 | |||||
| Imports of mineral fuels | - | 1229 | 1721.92 | 1662.57 | 1669.94 | 1715.96 | 1800.67 | 2194.14 | 1946.63 | 1616.14 | 1623.03 | 1508.33 | 1808.16 | 2771.57 | 2655.21 | 4357.54 | 4327.55 | 5716.48 | 6480.02 | |||||
| Imports of oils and fats | - | 8.9 | 14.2 | 10.38 | 15.33 | 18.08 | 41.13 | 42.86 | 99.28 | 118.54 | 45.4 | 47.74 | 52.41 | 63.87 | 80.14 | 88.51 | 94.53 | 86.62 | 89.25 | |||||
| Imports of chemicals | - | 1291.4 | 1419.65 | 1413.83 | 1474.84 | 1840.92 | 2195.83 | 2238.36 | 2404.57 | 2610.21 | 2664.43 | 2841.37 | 3004.84 | 3420.35 | 4596.74 | 5705.65 | 5849.27 | 6998.09 | 7719.94 | |||||
| Imports of basic manufactures | - | 1340.9 | 2170.94 | 2242.69 | 2269.81 | 2871.58 | 3538.03 | 3595.38 | 4186.8 | 4915.15 | 4956.67 | 5308.23 | 5476.57 | 6131.07 | 7648.67 | 9627.2 | 9127.04 | 10662.37 | 11770.04 | |||||
| Imports of machinery and transport equipment | - | 2992.3 | 3501.22 | 3201.17 | 3576.33 | 4505.49 | 4568.29 | 4889.95 | 8787.25 | 11892.36 | 13977.33 | 16366.12 | 17312.56 | 19406.01 | 24488.96 | 31890.49 | 32615.73 | 36684.22 | 39399.9 | |||||
| Imports of miscellaneous manufactured goods | - | 673.8 | 1294.73 | 1338.97 | 1335.82 | 1583.08 | 1633.85 | 1715.01 | 2072.81 | 2714.71 | 3050.67 | 3142.2 | 3186.72 | 3539.12 | 4494.4 | 5068.6 | 4829.25 | 5034.7 | 5241.2 | |||||
| Imports of other goods | - | 38.7 | 0.78 | 1.26 | 0.58 | 587.92 | 0 | 2.2 | 317.64 | 341.6 | 336.33 | 1372.18 | 1332.01 | 532.05 | 407.37 | 264.6 | 6534.63 | 7839.85 | 8840.05 | |||||
| Sources: | ||||||||||||||||||||||||
| 1 Imports (cif) of food and live animals, SITC classification 0: United Nations, UN Trade Statistics | ||||||||||||||||||||||||
| 2 Imports (cif) of beverages and tobacco, SITC classification 1: United Nations, UN Trade Statistics | ||||||||||||||||||||||||
| 3 Imports (cif) of crude materials exc. fuels, SITC classification 2: United Nations, UN Trade Statistics | ||||||||||||||||||||||||
| 4 Imports (cif) of mineral fuels, SITC classification 3: United Nations, UN Trade Statistics | ||||||||||||||||||||||||
| 5 Imports (cif) of oils and fats, SITC classification 4: United Nations, UN Trade Statistics | ||||||||||||||||||||||||
| 6 Imports (cif) of chemicals, SITC classification 5: United Nations, UN Trade Statistics | ||||||||||||||||||||||||
| 7 Imports (cif) of basic manufactures, SITC classification 6: United Nations, UN Trade Statistics | ||||||||||||||||||||||||
| 8 Imports (cif) of machinery and transport equipment, SITC classification 7: United Nations, UN Trade Statistics | ||||||||||||||||||||||||
| 9 Imports (cif) of miscellaneous manufactured goods, SITC classification 8: United Nations, UN Trade Statistics | ||||||||||||||||||||||||
| 10 Imports (cif) of other goods, SITC classification 9: United Nations, UN Trade Statistics | ||||||||||||||||||||||||
| 11 Exports (fob) of food and live animals, SITC classification 0: United Nations, UN Trade Statistics | ||||||||||||||||||||||||
| 12 Exports (fob) of beverages and tobacco, SITC classification 1: United Nations, UN Trade Statistics | ||||||||||||||||||||||||
| 13 Exports (fob) of crude materials exc. fuels, SITC classification 2: United Nations, UN Trade Statistics | ||||||||||||||||||||||||
| 14 Exports (fob) of mineral fuels, SITC classification 3: United Nations, UN Trade Statistics | ||||||||||||||||||||||||
| 15 Exports (fob) of oils and fats, SITC classification 4: United Nations, UN Trade Statistics | ||||||||||||||||||||||||
| 16 Exports (fob) of chemicals, SITC classification 5: United Nations, UN Trade Statistics | ||||||||||||||||||||||||
| 17 Exports (fob) of basic manufactures, SITC classification 6: United Nations, UN Trade Statistics | ||||||||||||||||||||||||
| 18 Exports (fob) of machinery and transport equipment, SITC classification 7: United Nations, UN Trade Statistics | ||||||||||||||||||||||||
| 19 Exports (fob) of miscellaneous manufactured goods, SITC classification 8: United Nations, UN Trade Statistics | ||||||||||||||||||||||||
| 20 Exports (fob) of other goods, SITC classification 9: United Nations, UN Trade Statistics |
Sheet1
| 0 | 0 |
| 0 | 0 |
| 0 | 0 |
| 0 | 0 |
| 0 | 0 |
| 0 | 0 |
| 0 | 0 |
| 0 | 0 |
| 0 | 0 |
| 0 | 0 |
| 0 | 0 |
Sheet2
| 0 | 0 |
| 0 | 0 |
| 0 | 0 |
| 0 | 0 |
| 0 | 0 |
| 0 | 0 |
| 0 | 0 |
| 0 | 0 |
| 0 | 0 |
| 0 | 0 |
| 0 | 0 |
Sheet3
_1258291778.xls
Chart9
| 5111.11 | 10657.42 |
| 5116.27 | 10599 |
| 5124.79 | 10529.28 |
| 5129.25 | 10460.48 |
| 5129.78 | 10404.83 |
| 5135.41 | 10374.82 |
| 5146.47 | 10373.15 |
| 5162.13 | 10373.64 |
| 5180.61 | 10365.04 |
| 5196.64 | 10350.02 |
| 5215.72 | 10336.7 |
| 5251.03 | 10321.23 |
| 5275.12 | 10301.24 |
| 5294.86 | 10279.73 |
| 5313.58 | 10253.42 |
| 5330.02 | 10221.64 |
| 5349.21 | 10200.3 |
| 5368.35 | 10174.85 |
| 5383.51 | 10142.36 |
| 5397.64 | 10116.74 |
| 5411.41 | 10097.55 |
| 5427.46 | 10076.58 |
| 5446.93 | 10057.88 |
Sheet1
| migration data from eurostat | ||||||||||||||||||||||||
| Hungary's migration | ||||||||||||||||||||||||
| 1985 | 1990 | 1995 | 2000 | 2005 | ||||||||||||||||||||
| International migration stock (% of population) | 3 | 3 | 3 | 3 | 3 | |||||||||||||||||||
| International migration stock, total | 339023 | 347510 | 293266 | 295990 | 316209 | |||||||||||||||||||
| Net migration | -65585 | -122622 | 100708 | 85000 | 65000 | |||||||||||||||||||
| denmark's migration | ||||||||||||||||||||||||
| 1985 | 1990 | 1995 | 2000 | 2005 | ||||||||||||||||||||
| International migration stock (% of population) | 4 | 4 | 5 | 6 | 7 | |||||||||||||||||||
| International migration stock, total | 190109 | 220193 | 249747 | 304249 | 388535 | |||||||||||||||||||
| Net migration | 9843 | 30114 | 58366 | 73469 | 45603 | |||||||||||||||||||
| total inflows of foreign population Dk-Hu | ||||||||||||||||||||||||
| 1995 | 1996 | 1997 | 1998 | 1999 | 2000 | 2001 | 2002 | 2003 | 2004 | 2005 | ||||||||||||||
| Denmark | 32.97 | 24.747 | 20.436 | 21.277 | 20.28 | 22.903 | 25.202 | 22.032 | 18.742 | 18.799 | .. | |||||||||||||
| Hungary | 14.008 | 13.734 | 13.283 | 16.052 | 20.151 | 20.184 | 20.308 | 17.972 | 19.365 | 22.164 | 18.809 | |||||||||||||
| total outflows of foreign population DK-HU | ||||||||||||||||||||||||
| 1995 | 1996 | 1997 | 1998 | 1999 | 2000 | 2001 | 2002 | 2003 | 2004 | 2005 | ||||||||||||||
| Denmark | 5.26 | 5.95 | 6.715 | 7.708 | 8.182 | 8.31 | 8.892 | 8.734 | 8.738 | 9.414 | .. | |||||||||||||
| Hungary | 2.401 | 2.833 | 1.928 | 2.343 | 2.46 | 2.208 | 1.944 | 2.388 | 2.553 | 3.466 | 3.846 | |||||||||||||
| data from oecd | ||||||||||||||||||||||||
| total migration HU | ||||||||||||||||||||||||
| 1995 | 1996 | 1997 | 1998 | 1999 | 2000 | 2001 | 2002 | 2003 | 2004 | 2005 | ||||||||||||||
| immigration | 14.008 | 13.734 | 13.283 | 16.052 | 20.151 | 20.184 | 20.308 | 17.972 | 19.365 | 22.164 | 18.809 | |||||||||||||
| otflow of foreign population | 2.401 | 2.833 | 1.928 | 2.343 | 2.46 | 2.208 | 1.944 | 2.388 | 2.553 | 3.466 | 3.846 | |||||||||||||
| total migration-DK | ||||||||||||||||||||||||
| 1995 | 1996 | 1997 | 1998 | 1999 | 2000 | 2001 | 2002 | 2003 | 2004 | 2005 | ||||||||||||||
| immigration | 32.97 | 24.747 | 20.436 | 21.277 | 20.28 | 22.903 | 25.202 | 22.032 | 18.742 | 18.799 | .. | |||||||||||||
| outflow of foreign population | 5.26 | 5.95 | 6.715 | 7.708 | 8.182 | 8.31 | 8.892 | 8.734 | 8.738 | 9.414 | .. | |||||||||||||
| immigration and emmigration in denmark (statbank) | ||||||||||||||||||||||||
| 1983 | 1984 | 1985 | 1986 | 1987 | 1988 | 1989 | 1990 | 1991 | 1992 | 1993 | 1994 | 1995 | 1996 | 1997 | 1998 | 1999 | 2000 | 2001 | 2002 | 2003 | 2004 | 2005 | 2006 | |
| Immigrated | 27718 | 29035 | 36214 | 38932 | 36296 | 35051 | 38391 | 40715 | 43567 | 43377 | 43400 | 44961 | 63187 | 54445 | 50105 | 51372 | 50236 | 52915 | 55984 | 52778 | 49754 | 49860 | 52458 | 56750 |
| Emigrated | 25999 | 25053 | 26715 | 27928 | 30123 | 34544 | 34949 | 32383 | 32629 | 31915 | 32344 | 34710 | 34630 | 37312 | 38393 | 40340 | 41340 | 43417 | 43980 | 43481 | 43466 | 45017 | 45869 | 46786 |
| danish immigration by continents | ||||||||||||||||||||||||
| 1983 | 1984 | 1985 | 1986 | 1987 | 1988 | 1989 | 1990 | 1991 | 1992 | 1993 | 1994 | 1995 | 1996 | 1997 | 1998 | 1999 | 2000 | 2001 | 2002 | 2003 | 2004 | 2005 | ||
| EU Countries | 4843 | 5098 | 6012 | 6217 | 5984 | 5560 | 5440 | 5819 | 6380 | 6363 | 7070 | 8179 | 7763 | 9192 | 9698 | 10314 | 9873 | 10616 | 11445 | 10537 | 10038 | 11203 | 13291 | |
| Europe (excl. EU Countries) | 2387 | 2811 | 3621 | 3925 | 4025 | 3881 | 3796 | 3719 | 4603 | 3881 | 3419 | 4008 | 21649 | 10431 | 6688 | 6031 | 5780 | 5937 | 6401 | 6383 | 5882 | 6161 | 6196 | |
| Africa | 516 | 753 | 824 | 979 | 1041 | 967 | 1184 | 1417 | 1844 | 1765 | 2385 | 2363 | 2606 | 3937 | 3082 | 2704 | 2234 | 2071 | 2141 | 1944 | 1619 | 1361 | 1016 | |
| North America | 1499 | 1644 | 1757 | 1855 | 1799 | 1727 | 1583 | 1800 | 1789 | 1648 | 1610 | 1451 | 1609 | 1591 | 1591 | 1698 | 1685 | 1725 | 1754 | 1815 | 1826 | 1986 | 2248 | |
| South and Central America | 271 | 287 | 264 | 313 | 405 | 434 | 466 | 575 | 682 | 558 | 557 | 542 | 578 | 608 | 686 | 726 | 856 | 850 | 790 | 805 | 648 | 643 | 685 | |
| Asia | 1962 | 2454 | 7292 | 8671 | 6401 | 5469 | 6270 | 5892 | 6201 | 6761 | 4952 | 3942 | 4410 | 5182 | 5171 | 6760 | 5620 | 7359 | 8385 | 7313 | 7008 | 5836 | 5769 | |
| danish immigrants by countries | ||||||||||||||||||||||||
| 1983 | 1984 | 1985 | 1986 | 1987 | 1988 | 1989 | 1990 | 1991 | 1992 | 1993 | 1994 | 1995 | 1996 | 1997 | 1998 | 1999 | 2000 | 2001 | 2002 | 2003 | 2004 | 2005 | ||
| Yugoslavia (former) | 209 | 299 | 435 | 511 | 587 | 610 | 604 | 666 | 803 | 552 | 272 | 215 | 650 | 2282 | 195 | 384 | 281 | 261 | 213 | 174 | 141 | 86 | 44 | |
| Poland | 218 | 311 | 1003 | 684 | 807 | 891 | 725 | 732 | 734 | 619 | 513 | 424 | 423 | 523 | 538 | 649 | 611 | 665 | 754 | 821 | 864 | 1157 | 1984 | |
| Turkey | 529 | 749 | 1417 | 1593 | 1790 | 1612 | 1405 | 1174 | 1915 | 1304 | 848 | 721 | 990 | 1402 | 1074 | 1287 | 1256 | 1183 | 1194 | 1116 | 502 | 488 | 426 | |
| Somalia | 10 | 13 | 18 | 23 | 48 | 79 | 198 | 195 | 578 | 699 | 1263 | 1034 | 1257 | 2010 | 1505 | 1005 | 568 | 421 | 449 | 478 | 394 | 215 | 119 | |
| Iraq | 19 | 91 | 480 | 385 | 221 | 442 | 504 | 408 | 433 | 1050 | 770 | 524 | 735 | 1015 | 954 | 1908 | 893 | 1369 | 1404 | 994 | 756 | 383 | 232 | |
| Iran | 54 | 627 | 3917 | 1134 | 1045 | 1000 | 652 | 707 | 779 | 552 | 393 | 270 | 233 | 356 | 336 | 355 | 311 | 556 | 662 | 457 | 319 | 228 | 214 | |
| Lebanon | 37 | 38 | 409 | 2448 | 1651 | 1104 | 1691 | 1347 | 1289 | 1339 | 537 | 271 | 234 | 257 | 242 | 324 | 248 | 357 | 261 | 248 | 111 | 129 | 88 | |
| Sri Lanka | 86 | 115 | 491 | 2369 | 1105 | 262 | 486 | 257 | 336 | 393 | 353 | 338 | 440 | 316 | 214 | 190 | 151 | 139 | 147 | 121 | 91 | 49 | 73 | |
| population, net migration in Hungary, DK | ||||||||||||||||||||||||
| Denmark | ||||||||||||||||||||||||
| 1985 | 1986 | 1987 | 1988 | 1989 | 1990 | 1991 | 1992 | 1993 | 1994 | 1995 | 1996 | 1997 | 1998 | 1999 | 2000 | 2001 | 2002 | 2003 | 2004 | 2005 | 2006 | 2007 | ||
| Foreign citizens, Denmark | - | - | - | - | - | 150.64 | 160.64 | 169.53 | 180.1 | 189.01 | 196.71 | 222.75 | 237.7 | 249.63 | 256.28 | 259.36 | 258.63 | 266.73 | 265.42 | 271.21 | 267.6 | 267.86 | - | |
| Net migration, Denmark | 9.79 | 11.31 | 6.38 | 0.66 | 3.68 | 8.55 | 10.88 | 11.58 | 11.47 | 10.51 | 28.67 | 17.5 | 11.99 | 11 | 9.38 | 10.09 | 12.02 | 9.61 | 7.03 | 4.96 | 6.73 | 9.96 | 5.47 | |
| Population, Denmark | 5111.11 | 5116.27 | 5124.79 | 5129.25 | 5129.78 | 5135.41 | 5146.47 | 5162.13 | 5180.61 | 5196.64 | 5215.72 | 5251.03 | 5275.12 | 5294.86 | 5313.58 | 5330.02 | 5349.21 | 5368.35 | 5383.51 | 5397.64 | 5411.41 | 5427.46 | 5446.93 | |
| Hungary | ||||||||||||||||||||||||
| 1985 | 1986 | 1987 | 1988 | 1989 | 1990 | 1991 | 1992 | 1993 | 1994 | 1995 | 1996 | 1997 | 1998 | 1999 | 2000 | 2001 | 2002 | 2003 | 2004 | 2005 | 2006 | 2007 | ||
| Foreign citizens, Hungary | - | - | - | - | - | 127.02 | 129.41 | 131.81 | 134.2 | 138 | 140 | 140 | 142.5 | 148.3 | 150.2 | 153.1 | 115.81 | 116.43 | 115.89 | 130.11 | 143.77 | 151.7 | - | |
| Net migration, Hungary | -41.01 | -50.83 | -52.04 | -39.9 | -8.62 | 18.31 | 18.1 | 18.45 | 18.19 | 17.97 | 17.91 | 17.87 | 17.57 | 17.26 | 16.79 | 16.66 | 9.69 | 3.54 | 15.56 | 18.16 | 17.27 | 14.2 | 14.17 | |
| Population, Hungary | 10657.42 | 10599 | 10529.28 | 10460.48 | 10404.83 | 10374.82 | 10373.15 | 10373.64 | 10365.04 | 10350.02 | 10336.7 | 10321.23 | 10301.24 | 10279.73 | 10253.42 | 10221.64 | 10200.3 | 10174.85 | 10142.36 | 10116.74 | 10097.55 | 10076.58 | 10057.88 | |
| Sources: | ||||||||||||||||||||||||
| 1 Population: national estimates at January 1st: Euromonitor International from national statistics/UN | ||||||||||||||||||||||||
| 2 Foreign citizens: Euromonitor International from trade sources/national statistics | ||||||||||||||||||||||||
| 3 Net migration: Euromonitor International from national statistical offices/UN | ||||||||||||||||||||||||
| exports, imports, trade balance | ||||||||||||||||||||||||
| Denmark | ||||||||||||||||||||||||
| 1985 | 1986 | 1987 | 1988 | 1989 | 1990 | 1991 | 1992 | 1993 | 1994 | 1995 | 1996 | 1997 | 1998 | 1999 | 2000 | 2001 | 2002 | 2003 | 2004 | 2005 | 2006 | |||
| Exports, Denmark | 17090.2 | 21285.6 | 25675.4 | 28502.4 | 29564.3 | 37037.2 | 37886.2 | 41675.7 | 38206.5 | 43120 | 51478.1 | 51479.9 | 49118.6 | 48839.2 | 50399.4 | 50380.2 | 51067.7 | 56303.5 | 65267 | 75619.9 | 83561.5 | 91710.3 | ||
| Imports, Denmark | 18245.3 | 22878.4 | 25498.6 | 27032.9 | 27801.4 | 33248.2 | 34057.2 | 35521.1 | 31330.6 | 36588.7 | 45728.1 | 45003.9 | 44406.3 | 46330.1 | 44519.3 | 44356 | 44123.8 | 48886.5 | 56216.5 | 66886.3 | 74258.9 | 85110.4 | ||
| Trade balance, Denmark | -1155.1 | -1592.8 | 176.8 | 1469.5 | 1762.9 | 3789 | 3829 | 6154.6 | 6875.9 | 6531.3 | 5750 | 6476 | 4712.3 | 2509.1 | 5880.1 | 6024.2 | 6943.9 | 7417 | 9050.5 | 8733.6 | 9302.6 | 6599.9 | ||
| Hungary | ||||||||||||||||||||||||
| 1985 | 1986 | 1987 | 1988 | 1989 | 1990 | 1991 | 1992 | 1993 | 1994 | 1995 | 1996 | 1997 | 1998 | 1999 | 2000 | 2001 | 2002 | 2003 | 2004 | 2005 | 2006 | |||
| Exports, Hungary | 8538.13 | 9165.43 | 9555.56 | 9949.37 | 10066.6 | 9597.78 | 10199.2 | 10663.5 | 8886.36 | 10434.2 | 12801.4 | 15631 | 18989.6 | 22991.6 | 24949.9 | 28015.9 | 30529.7 | 34511.6 | 42531.9 | 54892.3 | 62178.8 | 74216.4 | ||
| Imports, Hungary | 8223.68 | 9598.67 | 9841.47 | 9344.78 | 8709.07 | 8670.79 | 11417.3 | 11106.8 | 12468.4 | 14265.9 | 15379.5 | 18057.7 | 21115.4 | 25678.8 | 27922.8 | 31955.1 | 33724.5 | 37787.5 | 47601.6 | 59636.5 | 65783.3 | 77206.1 | ||
| Trade balance, Hungary | 314.45 | -433.24 | -285.91 | 604.59 | 1357.53 | 926.99 | -1218.1 | -443.3 | -3582.04 | -3831.7 | -2578.1 | -2426.7 | -2125.8 | -2687.2 | -2972.9 | -3939.2 | -3194.8 | -3275.9 | -5069.7 | -4744.2 | -3604.5 | -2989.7 | ||
| 1 Imports: Euromonitor International from International Monetary Fund (IMF), International Financial Statistics | ||||||||||||||||||||||||
| 2 Exports: Euromonitor International from International Monetary Fund (IMF), International Financial Statistics | ||||||||||||||||||||||||
| 3 Trade balance: Euromonitor International from International Monetary Fund (IMF), International Financial Statistics | ||||||||||||||||||||||||
| 1985 | 1986 | 1987 | 1988 | 1989 | 1990 | 1991 | 1992 | 1993 | 1994 | 1995 | 1996 | 1997 | 1998 | 1999 | 2000 | 2001 | 2002 | 2003 | 2004 | 2005 | 2006 | 2007 | ||
| Denmark | ||||||||||||||||||||||||
| Exports (fob) by destination S4 | 16548.53 | 20309.82 | 24422.14 | 26297.79 | 26929.39 | 33322.93 | 35899.17 | 41630.48 | 37619.8 | 42124.7 | 50388.43 | 50770.24 | 52648.49 | 52477.98 | 54440.82 | 55578.97 | 56172.04 | 61717.5 | 72761.77 | 83881.22 | 95725.13 | 107209.12 | - | |
| Exports (fob) by commodity S5 | - | - | - | - | 28046.2 | 34842.8 | 35713.06 | 39553.11 | 37170.99 | 41602.37 | 48789.13 | 48884.54 | 48800.43 | 47709.99 | 49027.81 | 49210.3 | 50977.56 | 55685.47 | 64613.99 | 74792.64 | 82415.35 | 90118.24 | 95222.66 | |
| Imports (cif) by origin S2 | 17468.74 | 21851.59 | 24255.99 | 25136.31 | 25085.39 | 30433.99 | 31144.51 | 34819.43 | 30109.73 | 35095.09 | 43679.54 | 42532.84 | 46219.28 | 48174.57 | 48855.06 | 49898.28 | 49601.1 | 54200.42 | 62898.42 | 74660.6 | 85286.62 | 99492.54 | 110598.12 | |
| Imports (cif) by commodity S3 | - | - | - | - | 26618.14 | 31575.71 | 32169.42 | 33590.32 | 30535.71 | 35436.45 | 43141.53 | 43126.35 | 44492.34 | 45700.68 | 44316.61 | 44586.86 | 44631.17 | 49312.59 | 56230.43 | 66895.19 | 74265.07 | 84510.99 | 92917.65 | |
| Hungary | ||||||||||||||||||||||||
| Exports (fob) by destination S4 | 5798.4 | 6431.9 | 6584.76 | 7361.61 | 6953.34 | 7398.89 | 9003.3 | 9431.9 | 7633 | 13149.6 | 16562.7 | 17324.82 | 24676.81 | 29526.43 | 30888.29 | 35177 | 38697.72 | 43444.85 | 55806.88 | 76422.63 | 91268.13 | 114996.49 | - | |
| Exports (fob) by commodity S5 | - | - | - | - | - | 9587.6 | 10186.9 | 10054.98 | 8240.06 | 10699.84 | 12452.02 | 12632.79 | 19099.19 | 23005.02 | 25012.19 | 28091.79 | 30497.74 | 34336.58 | 43007.78 | 55468.25 | 63240.57 | 74055.48 | 81272.78 | |
| Imports (cif) by origin S2 | 6187.4 | 7138.98 | 7321.53 | 7307.9 | 6680.16 | 7093.43 | 9231.8 | 8619.7 | 9380.5 | 17210.3 | 18583 | 20029.38 | 26039.22 | 30927.84 | 33635.29 | 38989.2 | 41158.4 | 46540.5 | 60306.43 | 78658 | 89823.66 | 109767.26 | 120710.86 | |
| Imports (cif) by commodity S3 | - | - | - | - | - | 8646.5 | 11371.26 | 10873.58 | 11376.08 | 14553.61 | 15185.56 | 16042.64 | 21234.01 | 25706.39 | 28008.23 | 32079.45 | 33681.74 | 37611.57 | 46674.97 | 60248.67 | 66741.34 | 76978.58 | 83913.31 | |
| Sources: | ||||||||||||||||||||||||
| 1 Foreign trade: Euromonitor International from trade sources/national statistics | ||||||||||||||||||||||||
| 2 Imports (cif) by origin: International Monetary Fund (IMF), Direction of Trade Statistics | ||||||||||||||||||||||||
| 3 Imports (cif) by commodity: United Nations, UN Trade Statistics | ||||||||||||||||||||||||
| 4 Exports (fob) by destination: International Monetary Fund (IMF), Direction of Trade Statistics | ||||||||||||||||||||||||
| 5 Exports (fob) by commodity: United Nations, UN Trade Statistics | ||||||||||||||||||||||||
| exports,imports by origin | ||||||||||||||||||||||||
| Denmark | ||||||||||||||||||||||||
| 1985 | 1986 | 1987 | 1988 | 1989 | 1990 | 1991 | 1992 | 1993 | 1994 | 1995 | 1996 | 1997 | 1998 | 1999 | 2000 | 2001 | 2002 | 2003 | 2004 | 2005 | 2006 | 2007 | ||
| Exports to Africa and the Middle East | 946.76 | 930.35 | 964.08 | 1170.47 | 1153.56 | 1650.44 | 1155.08 | 1686.62 | 1361.95 | 1634.94 | 1827.09 | 1407.98 | 1392.17 | 1410.42 | 1426.83 | 1332.85 | 1459.3 | 1639.89 | 1918.11 | 2119.83 | 2149.46 | 2002.33 | 2502.64 | |
| Exports to Asia-Pacific | 1055.57 | 1360.3 | 1863.53 | 2049.33 | 1969.42 | 2201.44 | 2350.54 | 2941.31 | 2868.25 | 3432.65 | 4304.39 | 4242.44 | 3897.13 | 3358.1 | 3692.14 | 3785.11 | 3855.94 | 4044.87 | 4916.76 | 5799.17 | 5925.29 | 6215.58 | 6257.59 | |
| Exports to Australasia | 143.16 | 141.92 | 162.89 | 183.35 | 213.15 | 195.66 | 182.6 | 212.89 | 229.78 | 282.5 | 317.66 | 331.2 | 339.31 | 326.85 | 371.68 | 368.58 | 358.91 | 426.7 | 565.37 | 823.29 | 751.11 | 855.18 | 1065.24 | |
| Exports to Europe, Denmark | 12120.82 | 15564.74 | 19129.26 | 20764.77 | 21475.94 | 27042.29 | 29839.11 | 33868.39 | 30340.04 | 33540.61 | 40812.41 | 41686.27 | 43736.32 | 44043.69 | 45220.04 | 45971.86 | 45871.88 | 50840.67 | 59964.08 | 69299.09 | 79726.2 | 90178.61 | 95408.43 | |
| Exports to EU-27, Denmark | 10011.43 | 12774 | 15816.75 | 17325.11 | 18221.29 | 22984.67 | 24352.63 | 27725.63 | 23572.72 | 25679.63 | 31307.92 | 31135.23 | 32839.48 | 32797.06 | 34490.85 | 36012.3 | 34961.19 | 38539.13 | 45475.03 | 52937.48 | 59639.18 | 65669.69 | 68871.65 | |
| Exports to Latin America | 360.12 | 336.91 | 292.83 | 348.5 | 361.96 | 352.46 | 615.55 | 852.88 | 740.72 | 835.92 | 952.35 | 862.75 | 824.94 | 799.31 | 720.11 | 791.5 | 734.78 | 763.61 | 762.39 | 895.23 | 982.31 | 1250.42 | 1198.89 | |
| Exports to USA | 1753.8 | 1796.25 | 1806.36 | 1589.21 | 1552.04 | 1700.2 | 1577.55 | 1882.94 | 1897.57 | 2185.27 | 1979.25 | 2032.93 | 2234.33 | 2263.84 | 2709.42 | 2994.22 | 3524.58 | 3569.16 | 4078.41 | 4379.78 | 5458.85 | 5778.21 | 7019.2 | |
| 1985 | 1986 | 1987 | 1988 | 1989 | 1990 | 1991 | 1992 | 1993 | 1994 | 1995 | 1996 | 1997 | 1998 | 1999 | 2000 | 2001 | 2002 | 2003 | 2004 | 2005 | 2006 | 2007 | ||
| Imports from Africa and the Middle East | 701.94 | 577.12 | 517.13 | 568.24 | 718.88 | 615.04 | 226.46 | 221.98 | 324.54 | 401.62 | 435.38 | 438.62 | 385.71 | 385.11 | 281.38 | 383.64 | 449.69 | 376.82 | 445.32 | 1032.44 | 1240.12 | 1018.84 | 741.62 | |
| Imports from Asia-Pacific | 1246.66 | 2023.24 | 2103.01 | 2230.99 | 2238.07 | 2735.05 | 2948.4 | 2870.83 | 2800.51 | 3365.31 | 3420.88 | 3321.99 | 3345.14 | 3521.7 | 3620.7 | 3803.75 | 3574.76 | 3765.01 | 5198.57 | 6528.32 | 7486.15 | 8507.46 | 9641.41 | |
| Imports from Australasia | 126.59 | 130.28 | 164.18 | 94.39 | 101.92 | 92.7 | 121.77 | 111.27 | 64.51 | 85.5 | 114.08 | 134.48 | 129.49 | 185.93 | 100.04 | 95.13 | 108.56 | 121.54 | 206.25 | 298.95 | 297.13 | 293.44 | 290.29 | |
| Imports from Europe, Denmark | 13719.41 | 17337.03 | 19541.31 | 20037.58 | 19482.56 | 24231.42 | 25068.33 | 28888.68 | 24732.42 | 28681.94 | 36807.26 | 35597.87 | 39090.2 | 40876.14 | 41966.32 | 42698.88 | 42503.87 | 47142.27 | 54190.53 | 63259.35 | 72745.07 | 85573.88 | 95170.63 | |
| Imports from EU-27 , Denmark | 11847.93 | 15119.29 | 16938 | 17251.97 | 16886.96 | 20723.34 | 21089.22 | 23810.06 | 19570.64 | 22465.24 | 29339.85 | 28056.12 | 31312.98 | 32597.66 | 33689.77 | 32917 | 32831.36 | 36936.74 | 42047.36 | 48508.5 | 53582.15 | 62099.2 | 68865.4 | |
| Imports from Latin America | 525.76 | 488.94 | 479.93 | 523.36 | 627.85 | 668.73 | 606.86 | 642.41 | 640.59 | 671.47 | 691.43 | 770.68 | 854.58 | 732.93 | 639.91 | 684.86 | 738.97 | 655.62 | 844.78 | 1046.61 | 1179.47 | 1225.86 | 1441.91 | |
| Imports from USA | 1074.85 | 1207.29 | 1350.91 | 1563.03 | 1778.96 | 1949.73 | 2011.93 | 1868.93 | 1417.15 | 1741.5 | 2058.38 | 2105.72 | 2242.96 | 2308.76 | 2018.14 | 1939.78 | 1964.76 | 1910.47 | 1827.72 | 2265.09 | 2064.45 | 2563.35 | 2650.81 | |
| Hungary | ||||||||||||||||||||||||
| 1985 | 1986 | 1987 | 1988 | 1989 | 1990 | 1991 | 1992 | 1993 | 1994 | 1995 | 1996 | 1997 | 1998 | 1999 | 2000 | 2001 | 2002 | 2003 | 2004 | 2005 | 2006 | 2007 | ||
| Exports to Africa and the Middle East | 685.78 | 470.92 | 452.91 | 539.66 | 441.29 | 416.32 | 483.9 | 337.8 | 258.8 | 204.3 | 385.4 | 318.2 | 312.09 | 321.13 | 260.75 | 306.2 | 380.03 | 579.28 | 1060.63 | 1376.06 | 1987.79 | 2496.7 | 2612.63 | |
| Exports to Asia-Pacific | 231.69 | 336.64 | 345 | 542.42 | 469.65 | 471.18 | 415.2 | 270.6 | 287.2 | 245 | 249.1 | 314.53 | 368.67 | 432.51 | 583.02 | 667.9 | 729.08 | 863.9 | 864.72 | 1262.16 | 1590.17 | 2395.77 | 2610.18 | |
| Exports to Australasia | 5.94 | 10.46 | 13.73 | 25.53 | 22.28 | 19.03 | 21.9 | 20.2 | 20.1 | 22 | 22.7 | 23.17 | 23.36 | 24.25 | 27.67 | 29.1 | 26.83 | 105.48 | 57.02 | 78.31 | 102.29 | 140.11 | 151.89 | |
| Exports to Europe, Hungary | 4528.43 | 5238.41 | 5340.3 | 5821.99 | 5558.88 | 6049.16 | 7627.7 | 8363.4 | 6626.8 | 12164.6 | 15417.3 | 16111.21 | 23239.31 | 27464.48 | 28530.58 | 32501.9 | 35858.59 | 40467.38 | 52247.7 | 71725.54 | 85301.03 | 107427.79 | 123281.3 | |
| Exports to EU-27, Hungary | 2499.69 | 2850.56 | 3150.48 | 3575.78 | 3691.71 | 4611.4 | 6188.2 | 6798.8 | 5198.1 | 7649.6 | 9295.3 | 9537.49 | 15468.55 | 18979.6 | 20976.69 | 23506.1 | 25298.73 | 28671.01 | 35698.04 | 46004.05 | 50838.35 | 59682.07 | 67571.99 | |
| Exports to Latin America | 119.4 | 121.8 | 104.11 | 93.81 | 106.52 | 74.75 | 100.4 | 48.5 | 41.7 | 48.1 | 53.5 | 70.75 | 77.34 | 175.98 | 154.25 | 157.8 | 164.97 | 184.92 | 169.49 | 262.04 | 306.19 | 348.06 | 341.86 | |
| Exports to USA | 197.08 | 214.4 | 286.96 | 293.63 | 318.71 | 339.53 | 322.5 | 343 | 373.5 | 430.5 | 413.1 | 464.33 | 618.62 | 1045.28 | 1298.67 | 1475 | 1495.25 | 1180.83 | 1342.31 | 1649.49 | 1892.89 | 2048.41 | 1843.46 | |
| 1985 | 1986 | 1987 | 1988 | 1989 | 1990 | 1991 | 1992 | 1993 | 1994 | 1995 | 1996 | 1997 | 1998 | 1999 | 2000 | 2001 | 2002 | 2003 | 2004 | 2005 | 2006 | 2007 | ||
| Imports from Africa and the Middle East | 183.48 | 113.18 | 181.83 | 154.71 | 71.55 | 345.92 | 370.4 | 49.5 | 50.4 | 83.2 | 141.9 | 203.97 | 177.88 | 201.24 | 196.14 | 200.1 | 236.07 | 207.38 | 227.47 | 141.69 | 174.8 | 180.83 | 284.62 | |
| Imports from Asia-Pacific | 323.96 | 506.75 | 544.53 | 522.94 | 464.8 | 488.09 | 637.6 | 494.9 | 657.3 | 783.5 | 841.3 | 1038.56 | 1919.81 | 2791.53 | 3293.7 | 4807.9 | 5156.75 | 6592.94 | 8676.99 | 8092.44 | 10365.59 | 11347.47 | 12252.41 | |
| Imports from Australasia | 31.56 | 14.82 | 13.23 | 19.71 | 12.82 | 8.61 | 371.2 | 7.5 | 5.6 | 5.2 | 6.6 | 14.41 | 18.08 | 27.26 | 20.28 | 25.4 | 32.17 | 24.93 | 45.67 | 36.78 | 20.89 | 17.94 | 39.53 | |
| Imports from Europe, Hungary | 5160.33 | 6096.77 | 6133.86 | 6105.05 | 5679.02 | 5796.14 | 7347.2 | 7541.9 | 7964.2 | 15658.6 | 16845.7 | 17909.72 | 22719.36 | 26392.14 | 28653.75 | 32232.9 | 33854.66 | 37798.42 | 49155.56 | 69073.59 | 77695.01 | 96719.45 | 106430.93 | |
| Imports from EU-27, Hungary | 3006.43 | 3554.95 | 3742.55 | 3778.36 | 3837.83 | 4425.68 | 6028.5 | 6350.6 | 6774.8 | 9714.6 | 10372 | 10714.35 | 14897.64 | 18307.48 | 20018.74 | 21226.2 | 22102.44 | 24241.35 | 30678.81 | 43620.6 | 46434.01 | 55031.83 | 60937.03 | |
| Imports from Latin America | 218.61 | 200.01 | 182.61 | 285.47 | 222.49 | 216.28 | 184.8 | 165 | 169.5 | 194.1 | 223.8 | 246.69 | 318 | 416.87 | 442.87 | 422.8 | 400.47 | 442.79 | 548.53 | 240.9 | 331.82 | 282.2 | 257.84 | |
| Imports from USA | 244.98 | 194.24 | 251.26 | 210.01 | 221.8 | 227.94 | 299.4 | 322.7 | 500.4 | 451.7 | 481.7 | 568.89 | 797.73 | 992.82 | 965.07 | 1223.7 | 1410.18 | 1373.19 | 1524.1 | 988.66 | 1095.37 | 1105.18 | 1312.54 | |
| Sources: | ||||||||||||||||||||||||
| 1 Imports (cif) from Asia-Pacific: International Monetary Fund (IMF), Direction of Trade Statistics | ||||||||||||||||||||||||
| 2 Imports (cif) from USA: International Monetary Fund (IMF), Direction of Trade Statistics | ||||||||||||||||||||||||
| 3 Exports (fob) to Asia-Pacific: International Monetary Fund (IMF), Direction of Trade Statistics | ||||||||||||||||||||||||
| 4 Exports (fob) to USA: International Monetary Fund (IMF), Direction of Trade Statistics | ||||||||||||||||||||||||
| 5 Exports (fob) to Latin America: Euromonitor International from trade sources/national statistics | ||||||||||||||||||||||||
| 6 Imports (cif) from Latin America: Euromonitor International from trade sources/national statistics | ||||||||||||||||||||||||
| 7 Imports (cif) from Europe: Euromonitor International from trade sources/national statistics | ||||||||||||||||||||||||
| 8 Exports (fob) to Europe: Euromonitor International from trade sources/national statistics | ||||||||||||||||||||||||
| 9 Imports (cif) from Australasia: Euromonitor International from trade sources/national statistics | ||||||||||||||||||||||||
| 10 Exports (fob) to Australasia: Euromonitor International from trade sources/national statistics | ||||||||||||||||||||||||
| 11 Exports (fob) to Africa and the Middle East: Euromonitor International from trade sources/national statistics | ||||||||||||||||||||||||
| 12 Imports (cif) from Africa and the Middle East: Euromonitor International from trade sources/national statistics | ||||||||||||||||||||||||
| 13 Imports (cif) from EU-27: Euromonitor International from trade sources/national statistics | ||||||||||||||||||||||||
| 14 Exports (fob) to EU-27: Euromonitor International from trade sources/national statistics | ||||||||||||||||||||||||
| exports, imports by commodity | ||||||||||||||||||||||||
| Denmark | ||||||||||||||||||||||||
| 1989 | 1990 | 1991 | 1992 | 1993 | 1994 | 1995 | 1996 | 1997 | 1998 | 1999 | 2000 | 2001 | 2002 | 2003 | 2004 | 2005 | 2006 | 2007 | ||||||
| Exports of food and live animals | 7200.95 | 8721.86 | 9070.13 | 9683.81 | 8980.06 | 9803.91 | 10867.2 | 10455.51 | 10632.09 | 9992.92 | 9455.12 | 8963.19 | 9592.5 | 9943.41 | 11348 | 12658.8 | 13190.44 | 14542.7 | 15013.02 | |||||
| Exports of beverages and tobacco | 288.91 | 369.2 | 390.33 | 422.76 | 412.03 | 430.59 | 539.46 | 483.66 | 492.12 | 479.83 | 470.76 | 545.23 | 475.19 | 614.87 | 821.56 | 874.91 | 880.33 | 965.79 | 989.35 | |||||
| Exports of crude materials exc. fuels | 1511.47 | 1636.85 | 1544.71 | 1538.25 | 1292.71 | 1460.76 | 1760.43 | 1779.35 | 1776.86 | 1598.52 | 1502.94 | 1490.19 | 1571.8 | 1902.65 | 2297.19 | 2712.96 | 2745.1 | 3289.39 | 3569.5 | |||||
| Exports of mineral fuels | 843.95 | 1163.87 | 1287.91 | 1356.07 | 1095.3 | 1033.55 | 1260.46 | 2097.24 | 1827.83 | 1310.49 | 1846.62 | 3450.36 | 2917.97 | 3441.58 | 4234.03 | 5869.14 | 7751.65 | 9237.32 | 10563.68 | |||||
| Exports of oils and fats | 133.06 | 151.5 | 146.93 | 165.96 | 139.79 | 189.22 | 278.79 | 264.11 | 278.71 | 263.62 | 232.01 | 181.76 | 191.87 | 223.02 | 272.06 | 366.89 | 418.78 | 478.23 | 521.07 | |||||
| Exports of chemicals | 2466.72 | 2951.75 | 2997.33 | 3571.56 | 3386.17 | 3807.33 | 4725.03 | 4691.39 | 5007.01 | 4788.7 | 5405.76 | 5378.63 | 6080.82 | 6809.58 | 8548.54 | 9623.99 | 10850.25 | 10964.25 | 11093.15 | |||||
| Exports of basic manufactures | 3102.16 | 3863.75 | 3876.41 | 4227.63 | 3691.52 | 4137.32 | 5256.56 | 5028.82 | 5265.22 | 5291.12 | 5421.68 | 5161.9 | 5145.62 | 5526.11 | 6471.07 | 7408.41 | 7824.54 | 9152.66 | 9769.61 | |||||
| Exports of machinery and transport equipment | 7033.82 | 9196.7 | 9029.22 | 10447.73 | 8981.59 | 10267.63 | 12260 | 12490 | 13158.32 | 13184.6 | 13682.95 | 13027.43 | 13983.45 | 16356.54 | 17829.6 | 20658.27 | 23176.97 | 24871.01 | 26412.85 | |||||
| Exports of miscellaneous manufactured goods | 4029.24 | 5122.99 | 5495.67 | 6138.08 | 5587.75 | 6089.86 | 7192.77 | 7020.28 | 7610.95 | 7953.47 | 8186.57 | 8266.84 | 8248.24 | 8660.25 | 10371.73 | 11872.98 | 12461.16 | 13815.02 | 14449.52 | |||||
| Exports of other goods | 1435.92 | 1664.34 | 1874.42 | 2001.26 | 3604.07 | 4382.2 | 4648.42 | 4574.18 | 2751.32 | 2846.73 | 2823.41 | 2744.75 | 2770.09 | 2207.46 | 2420.21 | 2746.29 | 3116.13 | 2801.86 | 2840.91 | |||||
| 1989 | 1990 | 1991 | 1992 | 1993 | 1994 | 1995 | 1996 | 1997 | 1998 | 1999 | 2000 | 2001 | 2002 | 2003 | 2004 | 2005 | 2006 | 2007 | ||||||
| Imports of food and live animals | 2798.28 | 3215.57 | 3420.19 | 3750.91 | 3471.02 | 3729.09 | 4310.89 | 4383.43 | 4587.06 | 4593.55 | 4440.47 | 4222.63 | 4276.3 | 4749.94 | 5654.87 | 6495.11 | 6963.06 | 7780.22 | 8400.01 | |||||
| Imports of beverages and tobacco | 305.21 | 374.71 | 387.58 | 438.29 | 432.56 | 451.79 | 546.4 | 574.35 | 696.92 | 635.87 | 647.34 | 588.83 | 599.84 | 678.56 | 830.96 | 926.03 | 941.07 | 1034.05 | 1113.04 | |||||
| Imports of crude materials exc. fuels | 1167.22 | 1238.93 | 1133.85 | 1231.34 | 1052.96 | 1345.09 | 1609.4 | 1478.74 | 1693.53 | 1692.57 | 1555.88 | 1466.47 | 1490.22 | 1589.2 | 1902.72 | 2064.78 | 2020.98 | 2456.58 | 2685.42 | |||||
| Imports of mineral fuels | 1922.46 | 2203.22 | 1694.27 | 1596.23 | 1534.07 | 1469.1 | 1436.07 | 1648.89 | 1700.64 | 1301.8 | 1361.98 | 2522.51 | 1826.47 | 2166.49 | 2656.49 | 3565.85 | 5009.25 | 4983.65 | 5259.96 | |||||
| Imports of oils and fats | 149.53 | 152.06 | 149.04 | 187.49 | 163.81 | 188.05 | 229.34 | 246.87 | 266.16 | 302.83 | 220.71 | 182.73 | 208.07 | 234.53 | 287.21 | 365.5 | 415.87 | 508.48 | 550.97 | |||||
| Imports of chemicals | 3013.89 | 3609.71 | 3572.03 | 3875.41 | 3394.21 | 3841.75 | 4821.33 | 4466.65 | 4693.86 | 4725.92 | 4500.65 | 4384.11 | 4598.01 | 5245.64 | 6194.44 | 7318.08 | 8096.08 | 9118.75 | 9980.04 | |||||
| Imports of basic manufactures | 5289.27 | 6187.39 | 6052.39 | 6467.16 | 5135.23 | 6091.51 | 7901.57 | 7097.92 | 7679.18 | 7948.82 | 7360.49 | 7209.07 | 7320.7 | 7698.29 | 9041.77 | 11050.22 | 11996.5 | 14203.3 | 15490.07 | |||||
| Imports of machinery and transport equipment | 8021.22 | 9969.16 | 10132.44 | 10027.87 | 8938.66 | 11032.67 | 13821.51 | 14000.15 | 14989.57 | 16115 | 15873.59 | 16020.15 | 15804.83 | 18557.24 | 19913.06 | 24121.56 | 26965.95 | 30677.13 | 34399.99 | |||||
| Imports of miscellaneous manufactured goods | 3252.66 | 3890.41 | 4244.35 | 4630.96 | 4182.53 | 4675.98 | 5495.78 | 5644.06 | 6626.88 | 6976.3 | 7127.16 | 6812.11 | 6955.09 | 7324.57 | 8725.54 | 9741.39 | 10713.57 | 12538.79 | 13750.01 | |||||
| Imports of other goods | 698.39 | 734.55 | 1383.27 | 1384.65 | 2230.65 | 2611.42 | 2969.24 | 3585.29 | 1558.54 | 1408.03 | 1228.35 | 1178.25 | 1551.65 | 1068.14 | 1023.36 | 1246.68 | 1142.74 | 1210.04 | 1288.14 | |||||
| Hungary | ||||||||||||||||||||||||
| 1989 | 1990 | 1991 | 1992 | 1993 | 1994 | 1995 | 1996 | 1997 | 1998 | 1999 | 2000 | 2001 | 2002 | 2003 | 2004 | 2005 | 2006 | 2007 | ||||||
| Exports of food and live animals | - | 1901.3 | 2258.1 | 2081.83 | 1415.37 | 1728.49 | 2256.91 | 2050.81 | 2195.15 | 2169.95 | 1825.5 | 1802.17 | 2145.96 | 2202.93 | 2650.98 | 3163.74 | 3356.22 | 3693.76 | 3963.81 | |||||
| Exports of beverages and tobacco | - | 129.1 | 93.2 | 143.9 | 188.76 | 192.03 | 258.75 | 323.62 | 224.75 | 202.22 | 150.75 | 102.99 | 101.65 | 109.17 | 138.3 | 155.65 | 144.62 | 187.08 | 191.71 | |||||
| Exports of crude materials exc. fuels | - | 455.2 | 632 | 556.05 | 494.5 | 523.27 | 595.81 | 573.3 | 523.64 | 500.66 | 483.58 | 562.06 | 527.58 | 613.19 | 768.83 | 1082.63 | 1086.32 | 1139.3 | 1177 | |||||
| Exports of mineral fuels | - | 296.3 | 298.1 | 326.41 | 307.67 | 367.59 | 383.8 | 427.06 | 432.8 | 424.47 | 397.54 | 453.21 | 483.73 | 510.42 | 689.96 | 1041.27 | 1619.58 | 1731.87 | 1797.13 | |||||
| Exports of oils and fats | - | 113 | 122.9 | 108.13 | 87.87 | 91.03 | 52.11 | 54.98 | 170.44 | 139.14 | 88.27 | 50.81 | 39.71 | 41.29 | 86.26 | 118.19 | 131.05 | 137.2 | 142.77 | |||||
| Exports of chemicals | - | 1191.2 | 1285.9 | 946.9 | 908.18 | 1048.58 | 1434.27 | 1312.1 | 1473.08 | 1466.48 | 1424.23 | 1709.09 | 1864.91 | 2118.06 | 2878.3 | 4118.42 | 4784.78 | 5739.08 | 6404.82 | |||||
| Exports of basic manufactures | - | 1769.8 | 1671.2 | 1594.61 | 1278.15 | 1591 | 2150.2 | 2265.96 | 2423.64 | 2741.83 | 2765.88 | 2945.37 | 3134.88 | 3471.27 | 4423.18 | 5626.33 | 6340.56 | 7070.57 | 7715.29 | |||||
| Exports of machinery and transport equipment | - | 2459 | 2255.3 | 2152.46 | 2004.86 | 2435.08 | 3247.64 | 3287.58 | 8575.9 | 11927.49 | 14283.64 | 16760.07 | 17509.78 | 20128.49 | 26260.55 | 34647 | 37180.61 | 44308.72 | 49003.66 | |||||
| Exports of miscellaneous manufactured goods | - | 1026 | 1560.3 | 2144.32 | 1549.06 | 1892.49 | 2068.84 | 2330.8 | 2560.38 | 3016.89 | 3232.43 | 3244.33 | 3899.04 | 4420.5 | 4547.6 | 5301.36 | 5528.27 | 5951.89 | 6295.29 | |||||
| Exports of other goods | - | 246.7 | 9.9 | 0.37 | 5.64 | 830.29 | 3.7 | 6.57 | 519.42 | 415.89 | 360.36 | 461.68 | 790.49 | 721.27 | 563.82 | 213.67 | 3068.56 | 4096.03 | 4581.32 | |||||
| 1989 | 1990 | 1991 | 1992 | 1993 | 1994 | 1995 | 1996 | 1997 | 1998 | 1999 | 2000 | 2001 | 2002 | 2003 | 2004 | 2005 | 2006 | 2007 | ||||||
| Imports of food and live animals | - | 548 | 543.66 | 511.03 | 618.09 | 811.66 | 716.17 | 690.05 | 772.63 | 832.99 | 730.99 | 800.04 | 881.47 | 1022.79 | 1330.5 | 2001.95 | 2192.75 | 2544.72 | 2813.91 | |||||
| Imports of beverages and tobacco | - | 69.5 | 84.06 | 80.51 | 55.78 | 92.2 | 79.01 | 99.64 | 103.43 | 101.21 | 101.15 | 67.81 | 76.18 | 86.69 | 120.48 | 218.39 | 184.8 | 338.19 | 395.05 | |||||
| Imports of crude materials exc. fuels | - | 454 | 620.11 | 411.15 | 359.55 | 526.72 | 612.58 | 575.06 | 542.95 | 563.47 | 522.24 | 625.44 | 550.83 | 638.05 | 852.5 | 1025.75 | 985.78 | 1073.34 | 1163.95 | |||||
| Imports of mineral fuels | - | 1229 | 1721.92 | 1662.57 | 1669.94 | 1715.96 | 1800.67 | 2194.14 | 1946.63 | 1616.14 | 1623.03 | 1508.33 | 1808.16 | 2771.57 | 2655.21 | 4357.54 | 4327.55 | 5716.48 | 6480.02 | |||||
| Imports of oils and fats | - | 8.9 | 14.2 | 10.38 | 15.33 | 18.08 | 41.13 | 42.86 | 99.28 | 118.54 | 45.4 | 47.74 | 52.41 | 63.87 | 80.14 | 88.51 | 94.53 | 86.62 | 89.25 | |||||
| Imports of chemicals | - | 1291.4 | 1419.65 | 1413.83 | 1474.84 | 1840.92 | 2195.83 | 2238.36 | 2404.57 | 2610.21 | 2664.43 | 2841.37 | 3004.84 | 3420.35 | 4596.74 | 5705.65 | 5849.27 | 6998.09 | 7719.94 | |||||
| Imports of basic manufactures | - | 1340.9 | 2170.94 | 2242.69 | 2269.81 | 2871.58 | 3538.03 | 3595.38 | 4186.8 | 4915.15 | 4956.67 | 5308.23 | 5476.57 | 6131.07 | 7648.67 | 9627.2 | 9127.04 | 10662.37 | 11770.04 | |||||
| Imports of machinery and transport equipment | - | 2992.3 | 3501.22 | 3201.17 | 3576.33 | 4505.49 | 4568.29 | 4889.95 | 8787.25 | 11892.36 | 13977.33 | 16366.12 | 17312.56 | 19406.01 | 24488.96 | 31890.49 | 32615.73 | 36684.22 | 39399.9 | |||||
| Imports of miscellaneous manufactured goods | - | 673.8 | 1294.73 | 1338.97 | 1335.82 | 1583.08 | 1633.85 | 1715.01 | 2072.81 | 2714.71 | 3050.67 | 3142.2 | 3186.72 | 3539.12 | 4494.4 | 5068.6 | 4829.25 | 5034.7 | 5241.2 | |||||
| Imports of other goods | - | 38.7 | 0.78 | 1.26 | 0.58 | 587.92 | 0 | 2.2 | 317.64 | 341.6 | 336.33 | 1372.18 | 1332.01 | 532.05 | 407.37 | 264.6 | 6534.63 | 7839.85 | 8840.05 | |||||
| Sources: | ||||||||||||||||||||||||
| 1 Imports (cif) of food and live animals, SITC classification 0: United Nations, UN Trade Statistics | ||||||||||||||||||||||||
| 2 Imports (cif) of beverages and tobacco, SITC classification 1: United Nations, UN Trade Statistics | ||||||||||||||||||||||||
| 3 Imports (cif) of crude materials exc. fuels, SITC classification 2: United Nations, UN Trade Statistics | ||||||||||||||||||||||||
| 4 Imports (cif) of mineral fuels, SITC classification 3: United Nations, UN Trade Statistics | ||||||||||||||||||||||||
| 5 Imports (cif) of oils and fats, SITC classification 4: United Nations, UN Trade Statistics | ||||||||||||||||||||||||
| 6 Imports (cif) of chemicals, SITC classification 5: United Nations, UN Trade Statistics | ||||||||||||||||||||||||
| 7 Imports (cif) of basic manufactures, SITC classification 6: United Nations, UN Trade Statistics | ||||||||||||||||||||||||
| 8 Imports (cif) of machinery and transport equipment, SITC classification 7: United Nations, UN Trade Statistics | ||||||||||||||||||||||||
| 9 Imports (cif) of miscellaneous manufactured goods, SITC classification 8: United Nations, UN Trade Statistics | ||||||||||||||||||||||||
| 10 Imports (cif) of other goods, SITC classification 9: United Nations, UN Trade Statistics | ||||||||||||||||||||||||
| 11 Exports (fob) of food and live animals, SITC classification 0: United Nations, UN Trade Statistics | ||||||||||||||||||||||||
| 12 Exports (fob) of beverages and tobacco, SITC classification 1: United Nations, UN Trade Statistics | ||||||||||||||||||||||||
| 13 Exports (fob) of crude materials exc. fuels, SITC classification 2: United Nations, UN Trade Statistics | ||||||||||||||||||||||||
| 14 Exports (fob) of mineral fuels, SITC classification 3: United Nations, UN Trade Statistics | ||||||||||||||||||||||||
| 15 Exports (fob) of oils and fats, SITC classification 4: United Nations, UN Trade Statistics | ||||||||||||||||||||||||
| 16 Exports (fob) of chemicals, SITC classification 5: United Nations, UN Trade Statistics | ||||||||||||||||||||||||
| 17 Exports (fob) of basic manufactures, SITC classification 6: United Nations, UN Trade Statistics | ||||||||||||||||||||||||
| 18 Exports (fob) of machinery and transport equipment, SITC classification 7: United Nations, UN Trade Statistics | ||||||||||||||||||||||||
| 19 Exports (fob) of miscellaneous manufactured goods, SITC classification 8: United Nations, UN Trade Statistics | ||||||||||||||||||||||||
| 20 Exports (fob) of other goods, SITC classification 9: United Nations, UN Trade Statistics |
Sheet1
| 0 | 0 | 0 |
| 0 | 0 | 0 |
| 0 | 0 | 0 |
| 0 | 0 | 0 |
| 0 | 0 | 0 |
Sheet2
| 0 | 0 | 0 |
| 0 | 0 | 0 |
| 0 | 0 | 0 |
| 0 | 0 | 0 |
| 0 | 0 | 0 |
Sheet3
| 0 | 0 | 0 |
| 0 | 0 | 0 |
| 0 | 0 | 0 |
| 0 | 0 | 0 |
| 0 | 0 | 0 |
| 0 | 0 | 0 |
| 0 | 0 | 0 |
| 0 | 0 | 0 |
| 0 | 0 | 0 |
| 0 | 0 | 0 |
| 0 | 0 |
| 0 | 0 |
| 0 | 0 |
| 0 | 0 |
| 0 | 0 |
| 0 | 0 |
| 0 | 0 |
| 0 | 0 |
| 0 | 0 |
| 0 | 0 |
| 0 | 0 |
| 0 | 0 |
| 0 | 0 |
| 0 | 0 |
| 0 | 0 |
| 0 | 0 |
| 0 | 0 |
| 0 | 0 |
| 0 | 0 |
| 0 | 0 |
| 0 | 0 |
| 0 | 0 |
| 0 | 0 |
| 0 | 0 |
| 0 | 0 |
| 0 | 0 |
| 0 | 0 |
| 0 | 0 |
| 0 | 0 |
| 0 | 0 |
| 0 | 0 |
| 0 | 0 |
| 0 | 0 |
| 0 | 0 |
| 0 | 0 |
| 0 | 0 |
| 0 | 0 |
| 0 | 0 |
| 0 | 0 |
| 0 | 0 |
| 0 | 0 |
| 0 | 0 |
| 0 | 0 |
| 0 | 0 |
| 0 | 0 |
| 0 | 0 |
| 0 | 0 |
| 0 | 0 |
| 0 | 0 |
| 0 | 0 |
| 0 | 0 |
| 0 | 0 |
| 0 | 0 |
| 0 | 0 |
| 0 | 0 |
| 0 | 0 |
| 0 | 0 |
| 0 | 0 |
| 0 | 0 |
| 0 | 0 |
| 0 | 0 |
| 0 | 0 |
| 0 | 0 |
| 0 | 0 |
| 0 | 0 |
| 0 | 0 |
| 0 | 0 |
| 0 | 0 |
| 0 | 0 |
| 0 | 0 |
| 0 | 0 |
| 0 | 0 |
| 0 | 0 |
| 0 | 0 |
| 0 | 0 |
| 0 | 0 |
| 0 | 0 |
| 0 | 0 |
| 0 | 0 |
| 0 | 0 |
| 0 | 0 |
| 0 | 0 |
| 0 | 0 |
| 0 | 0 |
| 0 | 0 |
| 0 | 0 |
| 0 | 0 |
| 0 | 0 |
| 0 | 0 |
| 0 | 0 |
| 0 | 0 |
| 0 | 0 |
| 0 | 0 |
| 0 | 0 |
| 0 | 0 |
| 0 | 0 |
| 0 | 0 |
| 0 | 0 |
| 0 | 0 |
| 0 | 0 |
| 0 | 0 |
| 0 | 0 |
| 0 | 0 |
| 0 | 0 |
| 0 | 0 |
| 0 | 0 |
| 0 | 0 |
| 0 | 0 |
| 0 | 0 |
| 0 | 0 |
| 0 | 0 |
| 0 | 0 |
| 0 | 0 |
| 0 | 0 |
| 0 | 0 |
| 0 | 0 |
| 0 | 0 |
| 0 | 0 |
| 0 | 0 | 0 |
| 0 | 0 | 0 |
| 0 | 0 | 0 |
| 0 | 0 | 0 |
| 0 | 0 | 0 |
| 0 | 0 | 0 |
| 0 | 0 | 0 |
| 0 | 0 | 0 |
| 0 | 0 | 0 |
| 0 | 0 | 0 |
| 0 | 0 | 0 |
| 0 | 0 | 0 |
| 0 | 0 | 0 |
| 0 | 0 | 0 |
| 0 | 0 | 0 |
| 0 | 0 | 0 |
| 0 | 0 | 0 |
| 0 | 0 | 0 |
| 0 | 0 | 0 |
| 0 | 0 | 0 |
| 0 | 0 | 0 |
| 0 | 0 | 0 |
| 0 | 0 | 0 |
| 0 | 0 | 0 |
| 0 | 0 | 0 |
| 0 | 0 | 0 |
| 0 | 0 | 0 |
| 0 | 0 | 0 |
| 0 | 0 | 0 |
| 0 | 0 | 0 |
| 0 | 0 | 0 |
| 0 | 0 | 0 |
| 0 | 0 | 0 |
| 0 | 0 | 0 |
| 0 | 0 | 0 |
| 0 | 0 | 0 |
| 0 | 0 | 0 |
| 0 | 0 | 0 |
| 0 | 0 | 0 |
| 0 | 0 | 0 |
| 0 | 0 | 0 |
| 0 | 0 | 0 |
| 0 | 0 | 0 |
| 0 | 0 | 0 |
| 0 | 0 |
| 0 | 0 |
| 0 | 0 |
| 0 | 0 |
| 0 | 0 |
| 0 | 0 |
| 0 | 0 |
| 0 | 0 |
| 0 | 0 |
| 0 | 0 |
| 0 | 0 |
| 0 | 0 |
| 0 | 0 |
| 0 | 0 |
| 0 | 0 |
| 0 | 0 |
| 0 | 0 |
| 0 | 0 |
| 0 | 0 |
| 0 | 0 |
| 0 | 0 |
| 0 | 0 |
| 0 | 0 |
| 0 | 0 |
| 0 | 0 | 0 | 0 | 0 | 0 |
| 0 | 0 | 0 | 0 | 0 | 0 |
| 0 | 0 | 0 | 0 | 0 | 0 |
| 0 | 0 | 0 | 0 | 0 | 0 |
| 0 | 0 | 0 | 0 | 0 | 0 |
| 0 | 0 | 0 | 0 | 0 | 0 |
| 0 | 0 | 0 | 0 | 0 | 0 |
| 0 | 0 | 0 | 0 | 0 | 0 |
| 0 | 0 | 0 | 0 | 0 | 0 |
| 0 | 0 | 0 | 0 | 0 | 0 |
| 0 | 0 | 0 | 0 | 0 | 0 |
| 0 | 0 | 0 | 0 | 0 | 0 |
| 0 | 0 | 0 | 0 | 0 | 0 |
| 0 | 0 | 0 | 0 | 0 | 0 |
| 0 | 0 | 0 | 0 | 0 | 0 |
| 0 | 0 | 0 | 0 | 0 | 0 |
| 0 | 0 | 0 | 0 | 0 | 0 |
| 0 | 0 | 0 | 0 | 0 | 0 |
| 0 | 0 | 0 | 0 | 0 | 0 |
| 0 | 0 | 0 | 0 | 0 | 0 |
| 0 | 0 | 0 | 0 | 0 | 0 |
| 0 | 0 | 0 | 0 | 0 | 0 |
| 0 | 0 | 0 | 0 | 0 | 0 |
| 0 | 0 | 0 | 0 | 0 | 0 |
_1258291815.xls
Chart10
| 9.79 | -41.01 |
| 11.31 | -50.83 |
| 6.38 | -52.04 |
| 0.66 | -39.9 |
| 3.68 | -8.62 |
| 8.55 | 18.31 |
| 10.88 | 18.1 |
| 11.58 | 18.45 |
| 11.47 | 18.19 |
| 10.51 | 17.97 |
| 28.67 | 17.91 |
| 17.5 | 17.87 |
| 11.99 | 17.57 |
| 11 | 17.26 |
| 9.38 | 16.79 |
| 10.09 | 16.66 |
| 12.02 | 9.69 |
| 9.61 | 3.54 |
| 7.03 | 15.56 |
| 4.96 | 18.16 |
| 6.73 | 17.27 |
| 9.96 | 14.2 |
| 5.47 | 14.17 |
Sheet1
| migration data from eurostat | ||||||||||||||||||||||||
| Hungary's migration | ||||||||||||||||||||||||
| 1985 | 1990 | 1995 | 2000 | 2005 | ||||||||||||||||||||
| International migration stock (% of population) | 3 | 3 | 3 | 3 | 3 | |||||||||||||||||||
| International migration stock, total | 339023 | 347510 | 293266 | 295990 | 316209 | |||||||||||||||||||
| Net migration | -65585 | -122622 | 100708 | 85000 | 65000 | |||||||||||||||||||
| denmark's migration | ||||||||||||||||||||||||
| 1985 | 1990 | 1995 | 2000 | 2005 | ||||||||||||||||||||
| International migration stock (% of population) | 4 | 4 | 5 | 6 | 7 | |||||||||||||||||||
| International migration stock, total | 190109 | 220193 | 249747 | 304249 | 388535 | |||||||||||||||||||
| Net migration | 9843 | 30114 | 58366 | 73469 | 45603 | |||||||||||||||||||
| total inflows of foreign population Dk-Hu | ||||||||||||||||||||||||
| 1995 | 1996 | 1997 | 1998 | 1999 | 2000 | 2001 | 2002 | 2003 | 2004 | 2005 | ||||||||||||||
| Denmark | 32.97 | 24.747 | 20.436 | 21.277 | 20.28 | 22.903 | 25.202 | 22.032 | 18.742 | 18.799 | .. | |||||||||||||
| Hungary | 14.008 | 13.734 | 13.283 | 16.052 | 20.151 | 20.184 | 20.308 | 17.972 | 19.365 | 22.164 | 18.809 | |||||||||||||
| total outflows of foreign population DK-HU | ||||||||||||||||||||||||
| 1995 | 1996 | 1997 | 1998 | 1999 | 2000 | 2001 | 2002 | 2003 | 2004 | 2005 | ||||||||||||||
| Denmark | 5.26 | 5.95 | 6.715 | 7.708 | 8.182 | 8.31 | 8.892 | 8.734 | 8.738 | 9.414 | .. | |||||||||||||
| Hungary | 2.401 | 2.833 | 1.928 | 2.343 | 2.46 | 2.208 | 1.944 | 2.388 | 2.553 | 3.466 | 3.846 | |||||||||||||
| data from oecd | ||||||||||||||||||||||||
| total migration HU | ||||||||||||||||||||||||
| 1995 | 1996 | 1997 | 1998 | 1999 | 2000 | 2001 | 2002 | 2003 | 2004 | 2005 | ||||||||||||||
| immigration | 14.008 | 13.734 | 13.283 | 16.052 | 20.151 | 20.184 | 20.308 | 17.972 | 19.365 | 22.164 | 18.809 | |||||||||||||
| otflow of foreign population | 2.401 | 2.833 | 1.928 | 2.343 | 2.46 | 2.208 | 1.944 | 2.388 | 2.553 | 3.466 | 3.846 | |||||||||||||
| total migration-DK | ||||||||||||||||||||||||
| 1995 | 1996 | 1997 | 1998 | 1999 | 2000 | 2001 | 2002 | 2003 | 2004 | 2005 | ||||||||||||||
| immigration | 32.97 | 24.747 | 20.436 | 21.277 | 20.28 | 22.903 | 25.202 | 22.032 | 18.742 | 18.799 | .. | |||||||||||||
| outflow of foreign population | 5.26 | 5.95 | 6.715 | 7.708 | 8.182 | 8.31 | 8.892 | 8.734 | 8.738 | 9.414 | .. | |||||||||||||
| immigration and emmigration in denmark (statbank) | ||||||||||||||||||||||||
| 1983 | 1984 | 1985 | 1986 | 1987 | 1988 | 1989 | 1990 | 1991 | 1992 | 1993 | 1994 | 1995 | 1996 | 1997 | 1998 | 1999 | 2000 | 2001 | 2002 | 2003 | 2004 | 2005 | 2006 | |
| Immigrated | 27718 | 29035 | 36214 | 38932 | 36296 | 35051 | 38391 | 40715 | 43567 | 43377 | 43400 | 44961 | 63187 | 54445 | 50105 | 51372 | 50236 | 52915 | 55984 | 52778 | 49754 | 49860 | 52458 | 56750 |
| Emigrated | 25999 | 25053 | 26715 | 27928 | 30123 | 34544 | 34949 | 32383 | 32629 | 31915 | 32344 | 34710 | 34630 | 37312 | 38393 | 40340 | 41340 | 43417 | 43980 | 43481 | 43466 | 45017 | 45869 | 46786 |
| danish immigration by continents | ||||||||||||||||||||||||
| 1983 | 1984 | 1985 | 1986 | 1987 | 1988 | 1989 | 1990 | 1991 | 1992 | 1993 | 1994 | 1995 | 1996 | 1997 | 1998 | 1999 | 2000 | 2001 | 2002 | 2003 | 2004 | 2005 | ||
| EU Countries | 4843 | 5098 | 6012 | 6217 | 5984 | 5560 | 5440 | 5819 | 6380 | 6363 | 7070 | 8179 | 7763 | 9192 | 9698 | 10314 | 9873 | 10616 | 11445 | 10537 | 10038 | 11203 | 13291 | |
| Europe (excl. EU Countries) | 2387 | 2811 | 3621 | 3925 | 4025 | 3881 | 3796 | 3719 | 4603 | 3881 | 3419 | 4008 | 21649 | 10431 | 6688 | 6031 | 5780 | 5937 | 6401 | 6383 | 5882 | 6161 | 6196 | |
| Africa | 516 | 753 | 824 | 979 | 1041 | 967 | 1184 | 1417 | 1844 | 1765 | 2385 | 2363 | 2606 | 3937 | 3082 | 2704 | 2234 | 2071 | 2141 | 1944 | 1619 | 1361 | 1016 | |
| North America | 1499 | 1644 | 1757 | 1855 | 1799 | 1727 | 1583 | 1800 | 1789 | 1648 | 1610 | 1451 | 1609 | 1591 | 1591 | 1698 | 1685 | 1725 | 1754 | 1815 | 1826 | 1986 | 2248 | |
| South and Central America | 271 | 287 | 264 | 313 | 405 | 434 | 466 | 575 | 682 | 558 | 557 | 542 | 578 | 608 | 686 | 726 | 856 | 850 | 790 | 805 | 648 | 643 | 685 | |
| Asia | 1962 | 2454 | 7292 | 8671 | 6401 | 5469 | 6270 | 5892 | 6201 | 6761 | 4952 | 3942 | 4410 | 5182 | 5171 | 6760 | 5620 | 7359 | 8385 | 7313 | 7008 | 5836 | 5769 | |
| danish immigrants by countries | ||||||||||||||||||||||||
| 1983 | 1984 | 1985 | 1986 | 1987 | 1988 | 1989 | 1990 | 1991 | 1992 | 1993 | 1994 | 1995 | 1996 | 1997 | 1998 | 1999 | 2000 | 2001 | 2002 | 2003 | 2004 | 2005 | ||
| Yugoslavia (former) | 209 | 299 | 435 | 511 | 587 | 610 | 604 | 666 | 803 | 552 | 272 | 215 | 650 | 2282 | 195 | 384 | 281 | 261 | 213 | 174 | 141 | 86 | 44 | |
| Poland | 218 | 311 | 1003 | 684 | 807 | 891 | 725 | 732 | 734 | 619 | 513 | 424 | 423 | 523 | 538 | 649 | 611 | 665 | 754 | 821 | 864 | 1157 | 1984 | |
| Turkey | 529 | 749 | 1417 | 1593 | 1790 | 1612 | 1405 | 1174 | 1915 | 1304 | 848 | 721 | 990 | 1402 | 1074 | 1287 | 1256 | 1183 | 1194 | 1116 | 502 | 488 | 426 | |
| Somalia | 10 | 13 | 18 | 23 | 48 | 79 | 198 | 195 | 578 | 699 | 1263 | 1034 | 1257 | 2010 | 1505 | 1005 | 568 | 421 | 449 | 478 | 394 | 215 | 119 | |
| Iraq | 19 | 91 | 480 | 385 | 221 | 442 | 504 | 408 | 433 | 1050 | 770 | 524 | 735 | 1015 | 954 | 1908 | 893 | 1369 | 1404 | 994 | 756 | 383 | 232 | |
| Iran | 54 | 627 | 3917 | 1134 | 1045 | 1000 | 652 | 707 | 779 | 552 | 393 | 270 | 233 | 356 | 336 | 355 | 311 | 556 | 662 | 457 | 319 | 228 | 214 | |
| Lebanon | 37 | 38 | 409 | 2448 | 1651 | 1104 | 1691 | 1347 | 1289 | 1339 | 537 | 271 | 234 | 257 | 242 | 324 | 248 | 357 | 261 | 248 | 111 | 129 | 88 | |
| Sri Lanka | 86 | 115 | 491 | 2369 | 1105 | 262 | 486 | 257 | 336 | 393 | 353 | 338 | 440 | 316 | 214 | 190 | 151 | 139 | 147 | 121 | 91 | 49 | 73 | |
| population, net migration in Hungary, DK | ||||||||||||||||||||||||
| Denmark | ||||||||||||||||||||||||
| 1985 | 1986 | 1987 | 1988 | 1989 | 1990 | 1991 | 1992 | 1993 | 1994 | 1995 | 1996 | 1997 | 1998 | 1999 | 2000 | 2001 | 2002 | 2003 | 2004 | 2005 | 2006 | 2007 | ||
| Foreign citizens, Denmark | - | - | - | - | - | 150.64 | 160.64 | 169.53 | 180.1 | 189.01 | 196.71 | 222.75 | 237.7 | 249.63 | 256.28 | 259.36 | 258.63 | 266.73 | 265.42 | 271.21 | 267.6 | 267.86 | - | |
| Net migration, Denmark | 9.79 | 11.31 | 6.38 | 0.66 | 3.68 | 8.55 | 10.88 | 11.58 | 11.47 | 10.51 | 28.67 | 17.5 | 11.99 | 11 | 9.38 | 10.09 | 12.02 | 9.61 | 7.03 | 4.96 | 6.73 | 9.96 | 5.47 | |
| Population, Denmark | 5111.11 | 5116.27 | 5124.79 | 5129.25 | 5129.78 | 5135.41 | 5146.47 | 5162.13 | 5180.61 | 5196.64 | 5215.72 | 5251.03 | 5275.12 | 5294.86 | 5313.58 | 5330.02 | 5349.21 | 5368.35 | 5383.51 | 5397.64 | 5411.41 | 5427.46 | 5446.93 | |
| Hungary | ||||||||||||||||||||||||
| 1985 | 1986 | 1987 | 1988 | 1989 | 1990 | 1991 | 1992 | 1993 | 1994 | 1995 | 1996 | 1997 | 1998 | 1999 | 2000 | 2001 | 2002 | 2003 | 2004 | 2005 | 2006 | 2007 | ||
| Foreign citizens, Hungary | - | - | - | - | - | 127.02 | 129.41 | 131.81 | 134.2 | 138 | 140 | 140 | 142.5 | 148.3 | 150.2 | 153.1 | 115.81 | 116.43 | 115.89 | 130.11 | 143.77 | 151.7 | - | |
| Net migration, Hungary | -41.01 | -50.83 | -52.04 | -39.9 | -8.62 | 18.31 | 18.1 | 18.45 | 18.19 | 17.97 | 17.91 | 17.87 | 17.57 | 17.26 | 16.79 | 16.66 | 9.69 | 3.54 | 15.56 | 18.16 | 17.27 | 14.2 | 14.17 | |
| Population, Hungary | 10657.42 | 10599 | 10529.28 | 10460.48 | 10404.83 | 10374.82 | 10373.15 | 10373.64 | 10365.04 | 10350.02 | 10336.7 | 10321.23 | 10301.24 | 10279.73 | 10253.42 | 10221.64 | 10200.3 | 10174.85 | 10142.36 | 10116.74 | 10097.55 | 10076.58 | 10057.88 | |
| Sources: | ||||||||||||||||||||||||
| 1 Population: national estimates at January 1st: Euromonitor International from national statistics/UN | ||||||||||||||||||||||||
| 2 Foreign citizens: Euromonitor International from trade sources/national statistics | ||||||||||||||||||||||||
| 3 Net migration: Euromonitor International from national statistical offices/UN | ||||||||||||||||||||||||
| exports, imports, trade balance | ||||||||||||||||||||||||
| Denmark | ||||||||||||||||||||||||
| 1985 | 1986 | 1987 | 1988 | 1989 | 1990 | 1991 | 1992 | 1993 | 1994 | 1995 | 1996 | 1997 | 1998 | 1999 | 2000 | 2001 | 2002 | 2003 | 2004 | 2005 | 2006 | |||
| Exports, Denmark | 17090.2 | 21285.6 | 25675.4 | 28502.4 | 29564.3 | 37037.2 | 37886.2 | 41675.7 | 38206.5 | 43120 | 51478.1 | 51479.9 | 49118.6 | 48839.2 | 50399.4 | 50380.2 | 51067.7 | 56303.5 | 65267 | 75619.9 | 83561.5 | 91710.3 | ||
| Imports, Denmark | 18245.3 | 22878.4 | 25498.6 | 27032.9 | 27801.4 | 33248.2 | 34057.2 | 35521.1 | 31330.6 | 36588.7 | 45728.1 | 45003.9 | 44406.3 | 46330.1 | 44519.3 | 44356 | 44123.8 | 48886.5 | 56216.5 | 66886.3 | 74258.9 | 85110.4 | ||
| Trade balance, Denmark | -1155.1 | -1592.8 | 176.8 | 1469.5 | 1762.9 | 3789 | 3829 | 6154.6 | 6875.9 | 6531.3 | 5750 | 6476 | 4712.3 | 2509.1 | 5880.1 | 6024.2 | 6943.9 | 7417 | 9050.5 | 8733.6 | 9302.6 | 6599.9 | ||
| Hungary | ||||||||||||||||||||||||
| 1985 | 1986 | 1987 | 1988 | 1989 | 1990 | 1991 | 1992 | 1993 | 1994 | 1995 | 1996 | 1997 | 1998 | 1999 | 2000 | 2001 | 2002 | 2003 | 2004 | 2005 | 2006 | |||
| Exports, Hungary | 8538.13 | 9165.43 | 9555.56 | 9949.37 | 10066.6 | 9597.78 | 10199.2 | 10663.5 | 8886.36 | 10434.2 | 12801.4 | 15631 | 18989.6 | 22991.6 | 24949.9 | 28015.9 | 30529.7 | 34511.6 | 42531.9 | 54892.3 | 62178.8 | 74216.4 | ||
| Imports, Hungary | 8223.68 | 9598.67 | 9841.47 | 9344.78 | 8709.07 | 8670.79 | 11417.3 | 11106.8 | 12468.4 | 14265.9 | 15379.5 | 18057.7 | 21115.4 | 25678.8 | 27922.8 | 31955.1 | 33724.5 | 37787.5 | 47601.6 | 59636.5 | 65783.3 | 77206.1 | ||
| Trade balance, Hungary | 314.45 | -433.24 | -285.91 | 604.59 | 1357.53 | 926.99 | -1218.1 | -443.3 | -3582.04 | -3831.7 | -2578.1 | -2426.7 | -2125.8 | -2687.2 | -2972.9 | -3939.2 | -3194.8 | -3275.9 | -5069.7 | -4744.2 | -3604.5 | -2989.7 | ||
| 1 Imports: Euromonitor International from International Monetary Fund (IMF), International Financial Statistics | ||||||||||||||||||||||||
| 2 Exports: Euromonitor International from International Monetary Fund (IMF), International Financial Statistics | ||||||||||||||||||||||||
| 3 Trade balance: Euromonitor International from International Monetary Fund (IMF), International Financial Statistics | ||||||||||||||||||||||||
| 1985 | 1986 | 1987 | 1988 | 1989 | 1990 | 1991 | 1992 | 1993 | 1994 | 1995 | 1996 | 1997 | 1998 | 1999 | 2000 | 2001 | 2002 | 2003 | 2004 | 2005 | 2006 | 2007 | ||
| Denmark | ||||||||||||||||||||||||
| Exports (fob) by destination S4 | 16548.53 | 20309.82 | 24422.14 | 26297.79 | 26929.39 | 33322.93 | 35899.17 | 41630.48 | 37619.8 | 42124.7 | 50388.43 | 50770.24 | 52648.49 | 52477.98 | 54440.82 | 55578.97 | 56172.04 | 61717.5 | 72761.77 | 83881.22 | 95725.13 | 107209.12 | - | |
| Exports (fob) by commodity S5 | - | - | - | - | 28046.2 | 34842.8 | 35713.06 | 39553.11 | 37170.99 | 41602.37 | 48789.13 | 48884.54 | 48800.43 | 47709.99 | 49027.81 | 49210.3 | 50977.56 | 55685.47 | 64613.99 | 74792.64 | 82415.35 | 90118.24 | 95222.66 | |
| Imports (cif) by origin S2 | 17468.74 | 21851.59 | 24255.99 | 25136.31 | 25085.39 | 30433.99 | 31144.51 | 34819.43 | 30109.73 | 35095.09 | 43679.54 | 42532.84 | 46219.28 | 48174.57 | 48855.06 | 49898.28 | 49601.1 | 54200.42 | 62898.42 | 74660.6 | 85286.62 | 99492.54 | 110598.12 | |
| Imports (cif) by commodity S3 | - | - | - | - | 26618.14 | 31575.71 | 32169.42 | 33590.32 | 30535.71 | 35436.45 | 43141.53 | 43126.35 | 44492.34 | 45700.68 | 44316.61 | 44586.86 | 44631.17 | 49312.59 | 56230.43 | 66895.19 | 74265.07 | 84510.99 | 92917.65 | |
| Hungary | ||||||||||||||||||||||||
| Exports (fob) by destination S4 | 5798.4 | 6431.9 | 6584.76 | 7361.61 | 6953.34 | 7398.89 | 9003.3 | 9431.9 | 7633 | 13149.6 | 16562.7 | 17324.82 | 24676.81 | 29526.43 | 30888.29 | 35177 | 38697.72 | 43444.85 | 55806.88 | 76422.63 | 91268.13 | 114996.49 | - | |
| Exports (fob) by commodity S5 | - | - | - | - | - | 9587.6 | 10186.9 | 10054.98 | 8240.06 | 10699.84 | 12452.02 | 12632.79 | 19099.19 | 23005.02 | 25012.19 | 28091.79 | 30497.74 | 34336.58 | 43007.78 | 55468.25 | 63240.57 | 74055.48 | 81272.78 | |
| Imports (cif) by origin S2 | 6187.4 | 7138.98 | 7321.53 | 7307.9 | 6680.16 | 7093.43 | 9231.8 | 8619.7 | 9380.5 | 17210.3 | 18583 | 20029.38 | 26039.22 | 30927.84 | 33635.29 | 38989.2 | 41158.4 | 46540.5 | 60306.43 | 78658 | 89823.66 | 109767.26 | 120710.86 | |
| Imports (cif) by commodity S3 | - | - | - | - | - | 8646.5 | 11371.26 | 10873.58 | 11376.08 | 14553.61 | 15185.56 | 16042.64 | 21234.01 | 25706.39 | 28008.23 | 32079.45 | 33681.74 | 37611.57 | 46674.97 | 60248.67 | 66741.34 | 76978.58 | 83913.31 | |
| Sources: | ||||||||||||||||||||||||
| 1 Foreign trade: Euromonitor International from trade sources/national statistics | ||||||||||||||||||||||||
| 2 Imports (cif) by origin: International Monetary Fund (IMF), Direction of Trade Statistics | ||||||||||||||||||||||||
| 3 Imports (cif) by commodity: United Nations, UN Trade Statistics | ||||||||||||||||||||||||
| 4 Exports (fob) by destination: International Monetary Fund (IMF), Direction of Trade Statistics | ||||||||||||||||||||||||
| 5 Exports (fob) by commodity: United Nations, UN Trade Statistics | ||||||||||||||||||||||||
| exports,imports by origin | ||||||||||||||||||||||||
| Denmark | ||||||||||||||||||||||||
| 1985 | 1986 | 1987 | 1988 | 1989 | 1990 | 1991 | 1992 | 1993 | 1994 | 1995 | 1996 | 1997 | 1998 | 1999 | 2000 | 2001 | 2002 | 2003 | 2004 | 2005 | 2006 | 2007 | ||
| Exports to Africa and the Middle East | 946.76 | 930.35 | 964.08 | 1170.47 | 1153.56 | 1650.44 | 1155.08 | 1686.62 | 1361.95 | 1634.94 | 1827.09 | 1407.98 | 1392.17 | 1410.42 | 1426.83 | 1332.85 | 1459.3 | 1639.89 | 1918.11 | 2119.83 | 2149.46 | 2002.33 | 2502.64 | |
| Exports to Asia-Pacific | 1055.57 | 1360.3 | 1863.53 | 2049.33 | 1969.42 | 2201.44 | 2350.54 | 2941.31 | 2868.25 | 3432.65 | 4304.39 | 4242.44 | 3897.13 | 3358.1 | 3692.14 | 3785.11 | 3855.94 | 4044.87 | 4916.76 | 5799.17 | 5925.29 | 6215.58 | 6257.59 | |
| Exports to Australasia | 143.16 | 141.92 | 162.89 | 183.35 | 213.15 | 195.66 | 182.6 | 212.89 | 229.78 | 282.5 | 317.66 | 331.2 | 339.31 | 326.85 | 371.68 | 368.58 | 358.91 | 426.7 | 565.37 | 823.29 | 751.11 | 855.18 | 1065.24 | |
| Exports to Europe, Denmark | 12120.82 | 15564.74 | 19129.26 | 20764.77 | 21475.94 | 27042.29 | 29839.11 | 33868.39 | 30340.04 | 33540.61 | 40812.41 | 41686.27 | 43736.32 | 44043.69 | 45220.04 | 45971.86 | 45871.88 | 50840.67 | 59964.08 | 69299.09 | 79726.2 | 90178.61 | 95408.43 | |
| Exports to EU-27, Denmark | 10011.43 | 12774 | 15816.75 | 17325.11 | 18221.29 | 22984.67 | 24352.63 | 27725.63 | 23572.72 | 25679.63 | 31307.92 | 31135.23 | 32839.48 | 32797.06 | 34490.85 | 36012.3 | 34961.19 | 38539.13 | 45475.03 | 52937.48 | 59639.18 | 65669.69 | 68871.65 | |
| Exports to Latin America | 360.12 | 336.91 | 292.83 | 348.5 | 361.96 | 352.46 | 615.55 | 852.88 | 740.72 | 835.92 | 952.35 | 862.75 | 824.94 | 799.31 | 720.11 | 791.5 | 734.78 | 763.61 | 762.39 | 895.23 | 982.31 | 1250.42 | 1198.89 | |
| Exports to USA | 1753.8 | 1796.25 | 1806.36 | 1589.21 | 1552.04 | 1700.2 | 1577.55 | 1882.94 | 1897.57 | 2185.27 | 1979.25 | 2032.93 | 2234.33 | 2263.84 | 2709.42 | 2994.22 | 3524.58 | 3569.16 | 4078.41 | 4379.78 | 5458.85 | 5778.21 | 7019.2 | |
| 1985 | 1986 | 1987 | 1988 | 1989 | 1990 | 1991 | 1992 | 1993 | 1994 | 1995 | 1996 | 1997 | 1998 | 1999 | 2000 | 2001 | 2002 | 2003 | 2004 | 2005 | 2006 | 2007 | ||
| Imports from Africa and the Middle East | 701.94 | 577.12 | 517.13 | 568.24 | 718.88 | 615.04 | 226.46 | 221.98 | 324.54 | 401.62 | 435.38 | 438.62 | 385.71 | 385.11 | 281.38 | 383.64 | 449.69 | 376.82 | 445.32 | 1032.44 | 1240.12 | 1018.84 | 741.62 | |
| Imports from Asia-Pacific | 1246.66 | 2023.24 | 2103.01 | 2230.99 | 2238.07 | 2735.05 | 2948.4 | 2870.83 | 2800.51 | 3365.31 | 3420.88 | 3321.99 | 3345.14 | 3521.7 | 3620.7 | 3803.75 | 3574.76 | 3765.01 | 5198.57 | 6528.32 | 7486.15 | 8507.46 | 9641.41 | |
| Imports from Australasia | 126.59 | 130.28 | 164.18 | 94.39 | 101.92 | 92.7 | 121.77 | 111.27 | 64.51 | 85.5 | 114.08 | 134.48 | 129.49 | 185.93 | 100.04 | 95.13 | 108.56 | 121.54 | 206.25 | 298.95 | 297.13 | 293.44 | 290.29 | |
| Imports from Europe, Denmark | 13719.41 | 17337.03 | 19541.31 | 20037.58 | 19482.56 | 24231.42 | 25068.33 | 28888.68 | 24732.42 | 28681.94 | 36807.26 | 35597.87 | 39090.2 | 40876.14 | 41966.32 | 42698.88 | 42503.87 | 47142.27 | 54190.53 | 63259.35 | 72745.07 | 85573.88 | 95170.63 | |
| Imports from EU-27 , Denmark | 11847.93 | 15119.29 | 16938 | 17251.97 | 16886.96 | 20723.34 | 21089.22 | 23810.06 | 19570.64 | 22465.24 | 29339.85 | 28056.12 | 31312.98 | 32597.66 | 33689.77 | 32917 | 32831.36 | 36936.74 | 42047.36 | 48508.5 | 53582.15 | 62099.2 | 68865.4 | |
| Imports from Latin America | 525.76 | 488.94 | 479.93 | 523.36 | 627.85 | 668.73 | 606.86 | 642.41 | 640.59 | 671.47 | 691.43 | 770.68 | 854.58 | 732.93 | 639.91 | 684.86 | 738.97 | 655.62 | 844.78 | 1046.61 | 1179.47 | 1225.86 | 1441.91 | |
| Imports from USA | 1074.85 | 1207.29 | 1350.91 | 1563.03 | 1778.96 | 1949.73 | 2011.93 | 1868.93 | 1417.15 | 1741.5 | 2058.38 | 2105.72 | 2242.96 | 2308.76 | 2018.14 | 1939.78 | 1964.76 | 1910.47 | 1827.72 | 2265.09 | 2064.45 | 2563.35 | 2650.81 | |
| Hungary | ||||||||||||||||||||||||
| 1985 | 1986 | 1987 | 1988 | 1989 | 1990 | 1991 | 1992 | 1993 | 1994 | 1995 | 1996 | 1997 | 1998 | 1999 | 2000 | 2001 | 2002 | 2003 | 2004 | 2005 | 2006 | 2007 | ||
| Exports to Africa and the Middle East | 685.78 | 470.92 | 452.91 | 539.66 | 441.29 | 416.32 | 483.9 | 337.8 | 258.8 | 204.3 | 385.4 | 318.2 | 312.09 | 321.13 | 260.75 | 306.2 | 380.03 | 579.28 | 1060.63 | 1376.06 | 1987.79 | 2496.7 | 2612.63 | |
| Exports to Asia-Pacific | 231.69 | 336.64 | 345 | 542.42 | 469.65 | 471.18 | 415.2 | 270.6 | 287.2 | 245 | 249.1 | 314.53 | 368.67 | 432.51 | 583.02 | 667.9 | 729.08 | 863.9 | 864.72 | 1262.16 | 1590.17 | 2395.77 | 2610.18 | |
| Exports to Australasia | 5.94 | 10.46 | 13.73 | 25.53 | 22.28 | 19.03 | 21.9 | 20.2 | 20.1 | 22 | 22.7 | 23.17 | 23.36 | 24.25 | 27.67 | 29.1 | 26.83 | 105.48 | 57.02 | 78.31 | 102.29 | 140.11 | 151.89 | |
| Exports to Europe, Hungary | 4528.43 | 5238.41 | 5340.3 | 5821.99 | 5558.88 | 6049.16 | 7627.7 | 8363.4 | 6626.8 | 12164.6 | 15417.3 | 16111.21 | 23239.31 | 27464.48 | 28530.58 | 32501.9 | 35858.59 | 40467.38 | 52247.7 | 71725.54 | 85301.03 | 107427.79 | 123281.3 | |
| Exports to EU-27, Hungary | 2499.69 | 2850.56 | 3150.48 | 3575.78 | 3691.71 | 4611.4 | 6188.2 | 6798.8 | 5198.1 | 7649.6 | 9295.3 | 9537.49 | 15468.55 | 18979.6 | 20976.69 | 23506.1 | 25298.73 | 28671.01 | 35698.04 | 46004.05 | 50838.35 | 59682.07 | 67571.99 | |
| Exports to Latin America | 119.4 | 121.8 | 104.11 | 93.81 | 106.52 | 74.75 | 100.4 | 48.5 | 41.7 | 48.1 | 53.5 | 70.75 | 77.34 | 175.98 | 154.25 | 157.8 | 164.97 | 184.92 | 169.49 | 262.04 | 306.19 | 348.06 | 341.86 | |
| Exports to USA | 197.08 | 214.4 | 286.96 | 293.63 | 318.71 | 339.53 | 322.5 | 343 | 373.5 | 430.5 | 413.1 | 464.33 | 618.62 | 1045.28 | 1298.67 | 1475 | 1495.25 | 1180.83 | 1342.31 | 1649.49 | 1892.89 | 2048.41 | 1843.46 | |
| 1985 | 1986 | 1987 | 1988 | 1989 | 1990 | 1991 | 1992 | 1993 | 1994 | 1995 | 1996 | 1997 | 1998 | 1999 | 2000 | 2001 | 2002 | 2003 | 2004 | 2005 | 2006 | 2007 | ||
| Imports from Africa and the Middle East | 183.48 | 113.18 | 181.83 | 154.71 | 71.55 | 345.92 | 370.4 | 49.5 | 50.4 | 83.2 | 141.9 | 203.97 | 177.88 | 201.24 | 196.14 | 200.1 | 236.07 | 207.38 | 227.47 | 141.69 | 174.8 | 180.83 | 284.62 | |
| Imports from Asia-Pacific | 323.96 | 506.75 | 544.53 | 522.94 | 464.8 | 488.09 | 637.6 | 494.9 | 657.3 | 783.5 | 841.3 | 1038.56 | 1919.81 | 2791.53 | 3293.7 | 4807.9 | 5156.75 | 6592.94 | 8676.99 | 8092.44 | 10365.59 | 11347.47 | 12252.41 | |
| Imports from Australasia | 31.56 | 14.82 | 13.23 | 19.71 | 12.82 | 8.61 | 371.2 | 7.5 | 5.6 | 5.2 | 6.6 | 14.41 | 18.08 | 27.26 | 20.28 | 25.4 | 32.17 | 24.93 | 45.67 | 36.78 | 20.89 | 17.94 | 39.53 | |
| Imports from Europe, Hungary | 5160.33 | 6096.77 | 6133.86 | 6105.05 | 5679.02 | 5796.14 | 7347.2 | 7541.9 | 7964.2 | 15658.6 | 16845.7 | 17909.72 | 22719.36 | 26392.14 | 28653.75 | 32232.9 | 33854.66 | 37798.42 | 49155.56 | 69073.59 | 77695.01 | 96719.45 | 106430.93 | |
| Imports from EU-27, Hungary | 3006.43 | 3554.95 | 3742.55 | 3778.36 | 3837.83 | 4425.68 | 6028.5 | 6350.6 | 6774.8 | 9714.6 | 10372 | 10714.35 | 14897.64 | 18307.48 | 20018.74 | 21226.2 | 22102.44 | 24241.35 | 30678.81 | 43620.6 | 46434.01 | 55031.83 | 60937.03 | |
| Imports from Latin America | 218.61 | 200.01 | 182.61 | 285.47 | 222.49 | 216.28 | 184.8 | 165 | 169.5 | 194.1 | 223.8 | 246.69 | 318 | 416.87 | 442.87 | 422.8 | 400.47 | 442.79 | 548.53 | 240.9 | 331.82 | 282.2 | 257.84 | |
| Imports from USA | 244.98 | 194.24 | 251.26 | 210.01 | 221.8 | 227.94 | 299.4 | 322.7 | 500.4 | 451.7 | 481.7 | 568.89 | 797.73 | 992.82 | 965.07 | 1223.7 | 1410.18 | 1373.19 | 1524.1 | 988.66 | 1095.37 | 1105.18 | 1312.54 | |
| Sources: | ||||||||||||||||||||||||
| 1 Imports (cif) from Asia-Pacific: International Monetary Fund (IMF), Direction of Trade Statistics | ||||||||||||||||||||||||
| 2 Imports (cif) from USA: International Monetary Fund (IMF), Direction of Trade Statistics | ||||||||||||||||||||||||
| 3 Exports (fob) to Asia-Pacific: International Monetary Fund (IMF), Direction of Trade Statistics | ||||||||||||||||||||||||
| 4 Exports (fob) to USA: International Monetary Fund (IMF), Direction of Trade Statistics | ||||||||||||||||||||||||
| 5 Exports (fob) to Latin America: Euromonitor International from trade sources/national statistics | ||||||||||||||||||||||||
| 6 Imports (cif) from Latin America: Euromonitor International from trade sources/national statistics | ||||||||||||||||||||||||
| 7 Imports (cif) from Europe: Euromonitor International from trade sources/national statistics | ||||||||||||||||||||||||
| 8 Exports (fob) to Europe: Euromonitor International from trade sources/national statistics | ||||||||||||||||||||||||
| 9 Imports (cif) from Australasia: Euromonitor International from trade sources/national statistics | ||||||||||||||||||||||||
| 10 Exports (fob) to Australasia: Euromonitor International from trade sources/national statistics | ||||||||||||||||||||||||
| 11 Exports (fob) to Africa and the Middle East: Euromonitor International from trade sources/national statistics | ||||||||||||||||||||||||
| 12 Imports (cif) from Africa and the Middle East: Euromonitor International from trade sources/national statistics | ||||||||||||||||||||||||
| 13 Imports (cif) from EU-27: Euromonitor International from trade sources/national statistics | ||||||||||||||||||||||||
| 14 Exports (fob) to EU-27: Euromonitor International from trade sources/national statistics | ||||||||||||||||||||||||
| exports, imports by commodity | ||||||||||||||||||||||||
| Denmark | ||||||||||||||||||||||||
| 1989 | 1990 | 1991 | 1992 | 1993 | 1994 | 1995 | 1996 | 1997 | 1998 | 1999 | 2000 | 2001 | 2002 | 2003 | 2004 | 2005 | 2006 | 2007 | ||||||
| Exports of food and live animals | 7200.95 | 8721.86 | 9070.13 | 9683.81 | 8980.06 | 9803.91 | 10867.2 | 10455.51 | 10632.09 | 9992.92 | 9455.12 | 8963.19 | 9592.5 | 9943.41 | 11348 | 12658.8 | 13190.44 | 14542.7 | 15013.02 | |||||
| Exports of beverages and tobacco | 288.91 | 369.2 | 390.33 | 422.76 | 412.03 | 430.59 | 539.46 | 483.66 | 492.12 | 479.83 | 470.76 | 545.23 | 475.19 | 614.87 | 821.56 | 874.91 | 880.33 | 965.79 | 989.35 | |||||
| Exports of crude materials exc. fuels | 1511.47 | 1636.85 | 1544.71 | 1538.25 | 1292.71 | 1460.76 | 1760.43 | 1779.35 | 1776.86 | 1598.52 | 1502.94 | 1490.19 | 1571.8 | 1902.65 | 2297.19 | 2712.96 | 2745.1 | 3289.39 | 3569.5 | |||||
| Exports of mineral fuels | 843.95 | 1163.87 | 1287.91 | 1356.07 | 1095.3 | 1033.55 | 1260.46 | 2097.24 | 1827.83 | 1310.49 | 1846.62 | 3450.36 | 2917.97 | 3441.58 | 4234.03 | 5869.14 | 7751.65 | 9237.32 | 10563.68 | |||||
| Exports of oils and fats | 133.06 | 151.5 | 146.93 | 165.96 | 139.79 | 189.22 | 278.79 | 264.11 | 278.71 | 263.62 | 232.01 | 181.76 | 191.87 | 223.02 | 272.06 | 366.89 | 418.78 | 478.23 | 521.07 | |||||
| Exports of chemicals | 2466.72 | 2951.75 | 2997.33 | 3571.56 | 3386.17 | 3807.33 | 4725.03 | 4691.39 | 5007.01 | 4788.7 | 5405.76 | 5378.63 | 6080.82 | 6809.58 | 8548.54 | 9623.99 | 10850.25 | 10964.25 | 11093.15 | |||||
| Exports of basic manufactures | 3102.16 | 3863.75 | 3876.41 | 4227.63 | 3691.52 | 4137.32 | 5256.56 | 5028.82 | 5265.22 | 5291.12 | 5421.68 | 5161.9 | 5145.62 | 5526.11 | 6471.07 | 7408.41 | 7824.54 | 9152.66 | 9769.61 | |||||
| Exports of machinery and transport equipment | 7033.82 | 9196.7 | 9029.22 | 10447.73 | 8981.59 | 10267.63 | 12260 | 12490 | 13158.32 | 13184.6 | 13682.95 | 13027.43 | 13983.45 | 16356.54 | 17829.6 | 20658.27 | 23176.97 | 24871.01 | 26412.85 | |||||
| Exports of miscellaneous manufactured goods | 4029.24 | 5122.99 | 5495.67 | 6138.08 | 5587.75 | 6089.86 | 7192.77 | 7020.28 | 7610.95 | 7953.47 | 8186.57 | 8266.84 | 8248.24 | 8660.25 | 10371.73 | 11872.98 | 12461.16 | 13815.02 | 14449.52 | |||||
| Exports of other goods | 1435.92 | 1664.34 | 1874.42 | 2001.26 | 3604.07 | 4382.2 | 4648.42 | 4574.18 | 2751.32 | 2846.73 | 2823.41 | 2744.75 | 2770.09 | 2207.46 | 2420.21 | 2746.29 | 3116.13 | 2801.86 | 2840.91 | |||||
| 1989 | 1990 | 1991 | 1992 | 1993 | 1994 | 1995 | 1996 | 1997 | 1998 | 1999 | 2000 | 2001 | 2002 | 2003 | 2004 | 2005 | 2006 | 2007 | ||||||
| Imports of food and live animals | 2798.28 | 3215.57 | 3420.19 | 3750.91 | 3471.02 | 3729.09 | 4310.89 | 4383.43 | 4587.06 | 4593.55 | 4440.47 | 4222.63 | 4276.3 | 4749.94 | 5654.87 | 6495.11 | 6963.06 | 7780.22 | 8400.01 | |||||
| Imports of beverages and tobacco | 305.21 | 374.71 | 387.58 | 438.29 | 432.56 | 451.79 | 546.4 | 574.35 | 696.92 | 635.87 | 647.34 | 588.83 | 599.84 | 678.56 | 830.96 | 926.03 | 941.07 | 1034.05 | 1113.04 | |||||
| Imports of crude materials exc. fuels | 1167.22 | 1238.93 | 1133.85 | 1231.34 | 1052.96 | 1345.09 | 1609.4 | 1478.74 | 1693.53 | 1692.57 | 1555.88 | 1466.47 | 1490.22 | 1589.2 | 1902.72 | 2064.78 | 2020.98 | 2456.58 | 2685.42 | |||||
| Imports of mineral fuels | 1922.46 | 2203.22 | 1694.27 | 1596.23 | 1534.07 | 1469.1 | 1436.07 | 1648.89 | 1700.64 | 1301.8 | 1361.98 | 2522.51 | 1826.47 | 2166.49 | 2656.49 | 3565.85 | 5009.25 | 4983.65 | 5259.96 | |||||
| Imports of oils and fats | 149.53 | 152.06 | 149.04 | 187.49 | 163.81 | 188.05 | 229.34 | 246.87 | 266.16 | 302.83 | 220.71 | 182.73 | 208.07 | 234.53 | 287.21 | 365.5 | 415.87 | 508.48 | 550.97 | |||||
| Imports of chemicals | 3013.89 | 3609.71 | 3572.03 | 3875.41 | 3394.21 | 3841.75 | 4821.33 | 4466.65 | 4693.86 | 4725.92 | 4500.65 | 4384.11 | 4598.01 | 5245.64 | 6194.44 | 7318.08 | 8096.08 | 9118.75 | 9980.04 | |||||
| Imports of basic manufactures | 5289.27 | 6187.39 | 6052.39 | 6467.16 | 5135.23 | 6091.51 | 7901.57 | 7097.92 | 7679.18 | 7948.82 | 7360.49 | 7209.07 | 7320.7 | 7698.29 | 9041.77 | 11050.22 | 11996.5 | 14203.3 | 15490.07 | |||||
| Imports of machinery and transport equipment | 8021.22 | 9969.16 | 10132.44 | 10027.87 | 8938.66 | 11032.67 | 13821.51 | 14000.15 | 14989.57 | 16115 | 15873.59 | 16020.15 | 15804.83 | 18557.24 | 19913.06 | 24121.56 | 26965.95 | 30677.13 | 34399.99 | |||||
| Imports of miscellaneous manufactured goods | 3252.66 | 3890.41 | 4244.35 | 4630.96 | 4182.53 | 4675.98 | 5495.78 | 5644.06 | 6626.88 | 6976.3 | 7127.16 | 6812.11 | 6955.09 | 7324.57 | 8725.54 | 9741.39 | 10713.57 | 12538.79 | 13750.01 | |||||
| Imports of other goods | 698.39 | 734.55 | 1383.27 | 1384.65 | 2230.65 | 2611.42 | 2969.24 | 3585.29 | 1558.54 | 1408.03 | 1228.35 | 1178.25 | 1551.65 | 1068.14 | 1023.36 | 1246.68 | 1142.74 | 1210.04 | 1288.14 | |||||
| Hungary | ||||||||||||||||||||||||
| 1989 | 1990 | 1991 | 1992 | 1993 | 1994 | 1995 | 1996 | 1997 | 1998 | 1999 | 2000 | 2001 | 2002 | 2003 | 2004 | 2005 | 2006 | 2007 | ||||||
| Exports of food and live animals | - | 1901.3 | 2258.1 | 2081.83 | 1415.37 | 1728.49 | 2256.91 | 2050.81 | 2195.15 | 2169.95 | 1825.5 | 1802.17 | 2145.96 | 2202.93 | 2650.98 | 3163.74 | 3356.22 | 3693.76 | 3963.81 | |||||
| Exports of beverages and tobacco | - | 129.1 | 93.2 | 143.9 | 188.76 | 192.03 | 258.75 | 323.62 | 224.75 | 202.22 | 150.75 | 102.99 | 101.65 | 109.17 | 138.3 | 155.65 | 144.62 | 187.08 | 191.71 | |||||
| Exports of crude materials exc. fuels | - | 455.2 | 632 | 556.05 | 494.5 | 523.27 | 595.81 | 573.3 | 523.64 | 500.66 | 483.58 | 562.06 | 527.58 | 613.19 | 768.83 | 1082.63 | 1086.32 | 1139.3 | 1177 | |||||
| Exports of mineral fuels | - | 296.3 | 298.1 | 326.41 | 307.67 | 367.59 | 383.8 | 427.06 | 432.8 | 424.47 | 397.54 | 453.21 | 483.73 | 510.42 | 689.96 | 1041.27 | 1619.58 | 1731.87 | 1797.13 | |||||
| Exports of oils and fats | - | 113 | 122.9 | 108.13 | 87.87 | 91.03 | 52.11 | 54.98 | 170.44 | 139.14 | 88.27 | 50.81 | 39.71 | 41.29 | 86.26 | 118.19 | 131.05 | 137.2 | 142.77 | |||||
| Exports of chemicals | - | 1191.2 | 1285.9 | 946.9 | 908.18 | 1048.58 | 1434.27 | 1312.1 | 1473.08 | 1466.48 | 1424.23 | 1709.09 | 1864.91 | 2118.06 | 2878.3 | 4118.42 | 4784.78 | 5739.08 | 6404.82 | |||||
| Exports of basic manufactures | - | 1769.8 | 1671.2 | 1594.61 | 1278.15 | 1591 | 2150.2 | 2265.96 | 2423.64 | 2741.83 | 2765.88 | 2945.37 | 3134.88 | 3471.27 | 4423.18 | 5626.33 | 6340.56 | 7070.57 | 7715.29 | |||||
| Exports of machinery and transport equipment | - | 2459 | 2255.3 | 2152.46 | 2004.86 | 2435.08 | 3247.64 | 3287.58 | 8575.9 | 11927.49 | 14283.64 | 16760.07 | 17509.78 | 20128.49 | 26260.55 | 34647 | 37180.61 | 44308.72 | 49003.66 | |||||
| Exports of miscellaneous manufactured goods | - | 1026 | 1560.3 | 2144.32 | 1549.06 | 1892.49 | 2068.84 | 2330.8 | 2560.38 | 3016.89 | 3232.43 | 3244.33 | 3899.04 | 4420.5 | 4547.6 | 5301.36 | 5528.27 | 5951.89 | 6295.29 | |||||
| Exports of other goods | - | 246.7 | 9.9 | 0.37 | 5.64 | 830.29 | 3.7 | 6.57 | 519.42 | 415.89 | 360.36 | 461.68 | 790.49 | 721.27 | 563.82 | 213.67 | 3068.56 | 4096.03 | 4581.32 | |||||
| 1989 | 1990 | 1991 | 1992 | 1993 | 1994 | 1995 | 1996 | 1997 | 1998 | 1999 | 2000 | 2001 | 2002 | 2003 | 2004 | 2005 | 2006 | 2007 | ||||||
| Imports of food and live animals | - | 548 | 543.66 | 511.03 | 618.09 | 811.66 | 716.17 | 690.05 | 772.63 | 832.99 | 730.99 | 800.04 | 881.47 | 1022.79 | 1330.5 | 2001.95 | 2192.75 | 2544.72 | 2813.91 | |||||
| Imports of beverages and tobacco | - | 69.5 | 84.06 | 80.51 | 55.78 | 92.2 | 79.01 | 99.64 | 103.43 | 101.21 | 101.15 | 67.81 | 76.18 | 86.69 | 120.48 | 218.39 | 184.8 | 338.19 | 395.05 | |||||
| Imports of crude materials exc. fuels | - | 454 | 620.11 | 411.15 | 359.55 | 526.72 | 612.58 | 575.06 | 542.95 | 563.47 | 522.24 | 625.44 | 550.83 | 638.05 | 852.5 | 1025.75 | 985.78 | 1073.34 | 1163.95 | |||||
| Imports of mineral fuels | - | 1229 | 1721.92 | 1662.57 | 1669.94 | 1715.96 | 1800.67 | 2194.14 | 1946.63 | 1616.14 | 1623.03 | 1508.33 | 1808.16 | 2771.57 | 2655.21 | 4357.54 | 4327.55 | 5716.48 | 6480.02 | |||||
| Imports of oils and fats | - | 8.9 | 14.2 | 10.38 | 15.33 | 18.08 | 41.13 | 42.86 | 99.28 | 118.54 | 45.4 | 47.74 | 52.41 | 63.87 | 80.14 | 88.51 | 94.53 | 86.62 | 89.25 | |||||
| Imports of chemicals | - | 1291.4 | 1419.65 | 1413.83 | 1474.84 | 1840.92 | 2195.83 | 2238.36 | 2404.57 | 2610.21 | 2664.43 | 2841.37 | 3004.84 | 3420.35 | 4596.74 | 5705.65 | 5849.27 | 6998.09 | 7719.94 | |||||
| Imports of basic manufactures | - | 1340.9 | 2170.94 | 2242.69 | 2269.81 | 2871.58 | 3538.03 | 3595.38 | 4186.8 | 4915.15 | 4956.67 | 5308.23 | 5476.57 | 6131.07 | 7648.67 | 9627.2 | 9127.04 | 10662.37 | 11770.04 | |||||
| Imports of machinery and transport equipment | - | 2992.3 | 3501.22 | 3201.17 | 3576.33 | 4505.49 | 4568.29 | 4889.95 | 8787.25 | 11892.36 | 13977.33 | 16366.12 | 17312.56 | 19406.01 | 24488.96 | 31890.49 | 32615.73 | 36684.22 | 39399.9 | |||||
| Imports of miscellaneous manufactured goods | - | 673.8 | 1294.73 | 1338.97 | 1335.82 | 1583.08 | 1633.85 | 1715.01 | 2072.81 | 2714.71 | 3050.67 | 3142.2 | 3186.72 | 3539.12 | 4494.4 | 5068.6 | 4829.25 | 5034.7 | 5241.2 | |||||
| Imports of other goods | - | 38.7 | 0.78 | 1.26 | 0.58 | 587.92 | 0 | 2.2 | 317.64 | 341.6 | 336.33 | 1372.18 | 1332.01 | 532.05 | 407.37 | 264.6 | 6534.63 | 7839.85 | 8840.05 | |||||
| Sources: | ||||||||||||||||||||||||
| 1 Imports (cif) of food and live animals, SITC classification 0: United Nations, UN Trade Statistics | ||||||||||||||||||||||||
| 2 Imports (cif) of beverages and tobacco, SITC classification 1: United Nations, UN Trade Statistics | ||||||||||||||||||||||||
| 3 Imports (cif) of crude materials exc. fuels, SITC classification 2: United Nations, UN Trade Statistics | ||||||||||||||||||||||||
| 4 Imports (cif) of mineral fuels, SITC classification 3: United Nations, UN Trade Statistics | ||||||||||||||||||||||||
| 5 Imports (cif) of oils and fats, SITC classification 4: United Nations, UN Trade Statistics | ||||||||||||||||||||||||
| 6 Imports (cif) of chemicals, SITC classification 5: United Nations, UN Trade Statistics | ||||||||||||||||||||||||
| 7 Imports (cif) of basic manufactures, SITC classification 6: United Nations, UN Trade Statistics | ||||||||||||||||||||||||
| 8 Imports (cif) of machinery and transport equipment, SITC classification 7: United Nations, UN Trade Statistics | ||||||||||||||||||||||||
| 9 Imports (cif) of miscellaneous manufactured goods, SITC classification 8: United Nations, UN Trade Statistics | ||||||||||||||||||||||||
| 10 Imports (cif) of other goods, SITC classification 9: United Nations, UN Trade Statistics | ||||||||||||||||||||||||
| 11 Exports (fob) of food and live animals, SITC classification 0: United Nations, UN Trade Statistics | ||||||||||||||||||||||||
| 12 Exports (fob) of beverages and tobacco, SITC classification 1: United Nations, UN Trade Statistics | ||||||||||||||||||||||||
| 13 Exports (fob) of crude materials exc. fuels, SITC classification 2: United Nations, UN Trade Statistics | ||||||||||||||||||||||||
| 14 Exports (fob) of mineral fuels, SITC classification 3: United Nations, UN Trade Statistics | ||||||||||||||||||||||||
| 15 Exports (fob) of oils and fats, SITC classification 4: United Nations, UN Trade Statistics | ||||||||||||||||||||||||
| 16 Exports (fob) of chemicals, SITC classification 5: United Nations, UN Trade Statistics | ||||||||||||||||||||||||
| 17 Exports (fob) of basic manufactures, SITC classification 6: United Nations, UN Trade Statistics | ||||||||||||||||||||||||
| 18 Exports (fob) of machinery and transport equipment, SITC classification 7: United Nations, UN Trade Statistics | ||||||||||||||||||||||||
| 19 Exports (fob) of miscellaneous manufactured goods, SITC classification 8: United Nations, UN Trade Statistics | ||||||||||||||||||||||||
| 20 Exports (fob) of other goods, SITC classification 9: United Nations, UN Trade Statistics |
Sheet1
| 0 | 0 | 0 |
| 0 | 0 | 0 |
| 0 | 0 | 0 |
| 0 | 0 | 0 |
| 0 | 0 | 0 |
Sheet2
| 0 | 0 | 0 |
| 0 | 0 | 0 |
| 0 | 0 | 0 |
| 0 | 0 | 0 |
| 0 | 0 | 0 |
Sheet3
| 0 | 0 | 0 |
| 0 | 0 | 0 |
| 0 | 0 | 0 |
| 0 | 0 | 0 |
| 0 | 0 | 0 |
| 0 | 0 | 0 |
| 0 | 0 | 0 |
| 0 | 0 | 0 |
| 0 | 0 | 0 |
| 0 | 0 | 0 |
| 0 | 0 |
| 0 | 0 |
| 0 | 0 |
| 0 | 0 |
| 0 | 0 |
| 0 | 0 |
| 0 | 0 |
| 0 | 0 |
| 0 | 0 |
| 0 | 0 |
| 0 | 0 |
| 0 | 0 |
| 0 | 0 |
| 0 | 0 |
| 0 | 0 |
| 0 | 0 |
| 0 | 0 |
| 0 | 0 |
| 0 | 0 |
| 0 | 0 |
| 0 | 0 |
| 0 | 0 |
| 0 | 0 |
| 0 | 0 |
| 0 | 0 |
| 0 | 0 |
| 0 | 0 |
| 0 | 0 |
| 0 | 0 |
| 0 | 0 |
| 0 | 0 |
| 0 | 0 |
| 0 | 0 |
| 0 | 0 |
| 0 | 0 |
| 0 | 0 |
| 0 | 0 |
| 0 | 0 |
| 0 | 0 |
| 0 | 0 |
| 0 | 0 |
| 0 | 0 |
| 0 | 0 |
| 0 | 0 |
| 0 | 0 |
| 0 | 0 |
| 0 | 0 |
| 0 | 0 |
| 0 | 0 |
| 0 | 0 |
| 0 | 0 |
| 0 | 0 |
| 0 | 0 |
| 0 | 0 |
| 0 | 0 |
| 0 | 0 |
| 0 | 0 |
| 0 | 0 |
| 0 | 0 |
| 0 | 0 |
| 0 | 0 |
| 0 | 0 |
| 0 | 0 |
| 0 | 0 |
| 0 | 0 |
| 0 | 0 |
| 0 | 0 |
| 0 | 0 |
| 0 | 0 |
| 0 | 0 |
| 0 | 0 |
| 0 | 0 |
| 0 | 0 |
| 0 | 0 |
| 0 | 0 |
| 0 | 0 |
| 0 | 0 |
| 0 | 0 |
| 0 | 0 |
| 0 | 0 |
| 0 | 0 |
| 0 | 0 |
| 0 | 0 |
| 0 | 0 |
| 0 | 0 |
| 0 | 0 |
| 0 | 0 |
| 0 | 0 |
| 0 | 0 |
| 0 | 0 |
| 0 | 0 |
| 0 | 0 |
| 0 | 0 |
| 0 | 0 |
| 0 | 0 | 0 |
| 0 | 0 | 0 |
| 0 | 0 | 0 |
| 0 | 0 | 0 |
| 0 | 0 | 0 |
| 0 | 0 | 0 |
| 0 | 0 | 0 |
| 0 | 0 | 0 |
| 0 | 0 | 0 |
| 0 | 0 | 0 |
| 0 | 0 | 0 |
| 0 | 0 | 0 |
| 0 | 0 | 0 |
| 0 | 0 | 0 |
| 0 | 0 | 0 |
| 0 | 0 | 0 |
| 0 | 0 | 0 |
| 0 | 0 | 0 |
| 0 | 0 | 0 |
| 0 | 0 | 0 |
| 0 | 0 | 0 |
| 0 | 0 | 0 |
| 0 | 0 | 0 |
| 0 | 0 | 0 |
| 0 | 0 | 0 |
| 0 | 0 | 0 |
| 0 | 0 | 0 |
| 0 | 0 | 0 |
| 0 | 0 | 0 |
| 0 | 0 | 0 |
| 0 | 0 | 0 |
| 0 | 0 | 0 |
| 0 | 0 | 0 |
| 0 | 0 | 0 |
| 0 | 0 | 0 |
| 0 | 0 | 0 |
| 0 | 0 | 0 |
| 0 | 0 | 0 |
| 0 | 0 | 0 |
| 0 | 0 | 0 |
| 0 | 0 | 0 |
| 0 | 0 | 0 |
| 0 | 0 | 0 |
| 0 | 0 | 0 |
| 0 | 0 |
| 0 | 0 |
| 0 | 0 |
| 0 | 0 |
| 0 | 0 |
| 0 | 0 |
| 0 | 0 |
| 0 | 0 |
| 0 | 0 |
| 0 | 0 |
| 0 | 0 |
| 0 | 0 |
| 0 | 0 |
| 0 | 0 |
| 0 | 0 |
| 0 | 0 |
| 0 | 0 |
| 0 | 0 |
| 0 | 0 |
| 0 | 0 |
| 0 | 0 |
| 0 | 0 |
| 0 | 0 |
| 0 | 0 |
| 0 | 0 | 0 | 0 | 0 | 0 |
| 0 | 0 | 0 | 0 | 0 | 0 |
| 0 | 0 | 0 | 0 | 0 | 0 |
| 0 | 0 | 0 | 0 | 0 | 0 |
| 0 | 0 | 0 | 0 | 0 | 0 |
| 0 | 0 | 0 | 0 | 0 | 0 |
| 0 | 0 | 0 | 0 | 0 | 0 |
| 0 | 0 | 0 | 0 | 0 | 0 |
| 0 | 0 | 0 | 0 | 0 | 0 |
| 0 | 0 | 0 | 0 | 0 | 0 |
| 0 | 0 | 0 | 0 | 0 | 0 |
| 0 | 0 | 0 | 0 | 0 | 0 |
| 0 | 0 | 0 | 0 | 0 | 0 |
| 0 | 0 | 0 | 0 | 0 | 0 |
| 0 | 0 | 0 | 0 | 0 | 0 |
| 0 | 0 | 0 | 0 | 0 | 0 |
| 0 | 0 | 0 | 0 | 0 | 0 |
| 0 | 0 | 0 | 0 | 0 | 0 |
| 0 | 0 | 0 | 0 | 0 | 0 |
| 0 | 0 | 0 | 0 | 0 | 0 |
| 0 | 0 | 0 | 0 | 0 | 0 |
| 0 | 0 | 0 | 0 | 0 | 0 |
| 0 | 0 | 0 | 0 | 0 | 0 |
| 0 | 0 | 0 | 0 | 0 | 0 |
_1258290831.xls
Chart11
| 0 | 0 |
| 0 | 0 |
| 0 | 0 |
| 0 | 0 |
| 0 | 0 |
| 150.64 | 127.02 |
| 160.64 | 129.41 |
| 169.53 | 131.81 |
| 180.1 | 134.2 |
| 189.01 | 138 |
| 196.71 | 140 |
| 222.75 | 140 |
| 237.7 | 142.5 |
| 249.63 | 148.3 |
| 256.28 | 150.2 |
| 259.36 | 153.1 |
| 258.63 | 115.81 |
| 266.73 | 116.43 |
| 265.42 | 115.89 |
| 271.21 | 130.11 |
| 267.6 | 143.77 |
| 267.86 | 151.7 |
| 0 | 0 |
Sheet1
| migration data from eurostat | ||||||||||||||||||||||||
| Hungary's migration | ||||||||||||||||||||||||
| 1985 | 1990 | 1995 | 2000 | 2005 | ||||||||||||||||||||
| International migration stock (% of population) | 3 | 3 | 3 | 3 | 3 | |||||||||||||||||||
| International migration stock, total | 339023 | 347510 | 293266 | 295990 | 316209 | |||||||||||||||||||
| Net migration | -65585 | -122622 | 100708 | 85000 | 65000 | |||||||||||||||||||
| denmark's migration | ||||||||||||||||||||||||
| 1985 | 1990 | 1995 | 2000 | 2005 | ||||||||||||||||||||
| International migration stock (% of population) | 4 | 4 | 5 | 6 | 7 | |||||||||||||||||||
| International migration stock, total | 190109 | 220193 | 249747 | 304249 | 388535 | |||||||||||||||||||
| Net migration | 9843 | 30114 | 58366 | 73469 | 45603 | |||||||||||||||||||
| total inflows of foreign population Dk-Hu | ||||||||||||||||||||||||
| 1995 | 1996 | 1997 | 1998 | 1999 | 2000 | 2001 | 2002 | 2003 | 2004 | 2005 | ||||||||||||||
| Denmark | 32.97 | 24.747 | 20.436 | 21.277 | 20.28 | 22.903 | 25.202 | 22.032 | 18.742 | 18.799 | .. | |||||||||||||
| Hungary | 14.008 | 13.734 | 13.283 | 16.052 | 20.151 | 20.184 | 20.308 | 17.972 | 19.365 | 22.164 | 18.809 | |||||||||||||
| total outflows of foreign population DK-HU | ||||||||||||||||||||||||
| 1995 | 1996 | 1997 | 1998 | 1999 | 2000 | 2001 | 2002 | 2003 | 2004 | 2005 | ||||||||||||||
| Denmark | 5.26 | 5.95 | 6.715 | 7.708 | 8.182 | 8.31 | 8.892 | 8.734 | 8.738 | 9.414 | .. | |||||||||||||
| Hungary | 2.401 | 2.833 | 1.928 | 2.343 | 2.46 | 2.208 | 1.944 | 2.388 | 2.553 | 3.466 | 3.846 | |||||||||||||
| data from oecd | ||||||||||||||||||||||||
| total migration HU | ||||||||||||||||||||||||
| 1995 | 1996 | 1997 | 1998 | 1999 | 2000 | 2001 | 2002 | 2003 | 2004 | 2005 | ||||||||||||||
| immigration | 14.008 | 13.734 | 13.283 | 16.052 | 20.151 | 20.184 | 20.308 | 17.972 | 19.365 | 22.164 | 18.809 | |||||||||||||
| otflow of foreign population | 2.401 | 2.833 | 1.928 | 2.343 | 2.46 | 2.208 | 1.944 | 2.388 | 2.553 | 3.466 | 3.846 | |||||||||||||
| total migration-DK | ||||||||||||||||||||||||
| 1995 | 1996 | 1997 | 1998 | 1999 | 2000 | 2001 | 2002 | 2003 | 2004 | 2005 | ||||||||||||||
| immigration | 32.97 | 24.747 | 20.436 | 21.277 | 20.28 | 22.903 | 25.202 | 22.032 | 18.742 | 18.799 | .. | |||||||||||||
| outflow of foreign population | 5.26 | 5.95 | 6.715 | 7.708 | 8.182 | 8.31 | 8.892 | 8.734 | 8.738 | 9.414 | .. | |||||||||||||
| immigration and emmigration in denmark (statbank) | ||||||||||||||||||||||||
| 1983 | 1984 | 1985 | 1986 | 1987 | 1988 | 1989 | 1990 | 1991 | 1992 | 1993 | 1994 | 1995 | 1996 | 1997 | 1998 | 1999 | 2000 | 2001 | 2002 | 2003 | 2004 | 2005 | 2006 | |
| Immigrated | 27718 | 29035 | 36214 | 38932 | 36296 | 35051 | 38391 | 40715 | 43567 | 43377 | 43400 | 44961 | 63187 | 54445 | 50105 | 51372 | 50236 | 52915 | 55984 | 52778 | 49754 | 49860 | 52458 | 56750 |
| Emigrated | 25999 | 25053 | 26715 | 27928 | 30123 | 34544 | 34949 | 32383 | 32629 | 31915 | 32344 | 34710 | 34630 | 37312 | 38393 | 40340 | 41340 | 43417 | 43980 | 43481 | 43466 | 45017 | 45869 | 46786 |
| danish immigration by continents | ||||||||||||||||||||||||
| 1983 | 1984 | 1985 | 1986 | 1987 | 1988 | 1989 | 1990 | 1991 | 1992 | 1993 | 1994 | 1995 | 1996 | 1997 | 1998 | 1999 | 2000 | 2001 | 2002 | 2003 | 2004 | 2005 | ||
| EU Countries | 4843 | 5098 | 6012 | 6217 | 5984 | 5560 | 5440 | 5819 | 6380 | 6363 | 7070 | 8179 | 7763 | 9192 | 9698 | 10314 | 9873 | 10616 | 11445 | 10537 | 10038 | 11203 | 13291 | |
| Europe (excl. EU Countries) | 2387 | 2811 | 3621 | 3925 | 4025 | 3881 | 3796 | 3719 | 4603 | 3881 | 3419 | 4008 | 21649 | 10431 | 6688 | 6031 | 5780 | 5937 | 6401 | 6383 | 5882 | 6161 | 6196 | |
| Africa | 516 | 753 | 824 | 979 | 1041 | 967 | 1184 | 1417 | 1844 | 1765 | 2385 | 2363 | 2606 | 3937 | 3082 | 2704 | 2234 | 2071 | 2141 | 1944 | 1619 | 1361 | 1016 | |
| North America | 1499 | 1644 | 1757 | 1855 | 1799 | 1727 | 1583 | 1800 | 1789 | 1648 | 1610 | 1451 | 1609 | 1591 | 1591 | 1698 | 1685 | 1725 | 1754 | 1815 | 1826 | 1986 | 2248 | |
| South and Central America | 271 | 287 | 264 | 313 | 405 | 434 | 466 | 575 | 682 | 558 | 557 | 542 | 578 | 608 | 686 | 726 | 856 | 850 | 790 | 805 | 648 | 643 | 685 | |
| Asia | 1962 | 2454 | 7292 | 8671 | 6401 | 5469 | 6270 | 5892 | 6201 | 6761 | 4952 | 3942 | 4410 | 5182 | 5171 | 6760 | 5620 | 7359 | 8385 | 7313 | 7008 | 5836 | 5769 | |
| danish immigrants by countries | ||||||||||||||||||||||||
| 1983 | 1984 | 1985 | 1986 | 1987 | 1988 | 1989 | 1990 | 1991 | 1992 | 1993 | 1994 | 1995 | 1996 | 1997 | 1998 | 1999 | 2000 | 2001 | 2002 | 2003 | 2004 | 2005 | ||
| Yugoslavia (former) | 209 | 299 | 435 | 511 | 587 | 610 | 604 | 666 | 803 | 552 | 272 | 215 | 650 | 2282 | 195 | 384 | 281 | 261 | 213 | 174 | 141 | 86 | 44 | |
| Poland | 218 | 311 | 1003 | 684 | 807 | 891 | 725 | 732 | 734 | 619 | 513 | 424 | 423 | 523 | 538 | 649 | 611 | 665 | 754 | 821 | 864 | 1157 | 1984 | |
| Turkey | 529 | 749 | 1417 | 1593 | 1790 | 1612 | 1405 | 1174 | 1915 | 1304 | 848 | 721 | 990 | 1402 | 1074 | 1287 | 1256 | 1183 | 1194 | 1116 | 502 | 488 | 426 | |
| Somalia | 10 | 13 | 18 | 23 | 48 | 79 | 198 | 195 | 578 | 699 | 1263 | 1034 | 1257 | 2010 | 1505 | 1005 | 568 | 421 | 449 | 478 | 394 | 215 | 119 | |
| Iraq | 19 | 91 | 480 | 385 | 221 | 442 | 504 | 408 | 433 | 1050 | 770 | 524 | 735 | 1015 | 954 | 1908 | 893 | 1369 | 1404 | 994 | 756 | 383 | 232 | |
| Iran | 54 | 627 | 3917 | 1134 | 1045 | 1000 | 652 | 707 | 779 | 552 | 393 | 270 | 233 | 356 | 336 | 355 | 311 | 556 | 662 | 457 | 319 | 228 | 214 | |
| Lebanon | 37 | 38 | 409 | 2448 | 1651 | 1104 | 1691 | 1347 | 1289 | 1339 | 537 | 271 | 234 | 257 | 242 | 324 | 248 | 357 | 261 | 248 | 111 | 129 | 88 | |
| Sri Lanka | 86 | 115 | 491 | 2369 | 1105 | 262 | 486 | 257 | 336 | 393 | 353 | 338 | 440 | 316 | 214 | 190 | 151 | 139 | 147 | 121 | 91 | 49 | 73 | |
| population, net migration in Hungary, DK | ||||||||||||||||||||||||
| Denmark | ||||||||||||||||||||||||
| 1985 | 1986 | 1987 | 1988 | 1989 | 1990 | 1991 | 1992 | 1993 | 1994 | 1995 | 1996 | 1997 | 1998 | 1999 | 2000 | 2001 | 2002 | 2003 | 2004 | 2005 | 2006 | 2007 | ||
| Foreign citizens, Denmark | - | - | - | - | - | 150.64 | 160.64 | 169.53 | 180.1 | 189.01 | 196.71 | 222.75 | 237.7 | 249.63 | 256.28 | 259.36 | 258.63 | 266.73 | 265.42 | 271.21 | 267.6 | 267.86 | - | |
| Net migration, Denmark | 9.79 | 11.31 | 6.38 | 0.66 | 3.68 | 8.55 | 10.88 | 11.58 | 11.47 | 10.51 | 28.67 | 17.5 | 11.99 | 11 | 9.38 | 10.09 | 12.02 | 9.61 | 7.03 | 4.96 | 6.73 | 9.96 | 5.47 | |
| Population, Denmark | 5111.11 | 5116.27 | 5124.79 | 5129.25 | 5129.78 | 5135.41 | 5146.47 | 5162.13 | 5180.61 | 5196.64 | 5215.72 | 5251.03 | 5275.12 | 5294.86 | 5313.58 | 5330.02 | 5349.21 | 5368.35 | 5383.51 | 5397.64 | 5411.41 | 5427.46 | 5446.93 | |
| Hungary | ||||||||||||||||||||||||
| 1985 | 1986 | 1987 | 1988 | 1989 | 1990 | 1991 | 1992 | 1993 | 1994 | 1995 | 1996 | 1997 | 1998 | 1999 | 2000 | 2001 | 2002 | 2003 | 2004 | 2005 | 2006 | 2007 | ||
| Foreign citizens, Hungary | - | - | - | - | - | 127.02 | 129.41 | 131.81 | 134.2 | 138 | 140 | 140 | 142.5 | 148.3 | 150.2 | 153.1 | 115.81 | 116.43 | 115.89 | 130.11 | 143.77 | 151.7 | - | |
| Net migration, Hungary | -41.01 | -50.83 | -52.04 | -39.9 | -8.62 | 18.31 | 18.1 | 18.45 | 18.19 | 17.97 | 17.91 | 17.87 | 17.57 | 17.26 | 16.79 | 16.66 | 9.69 | 3.54 | 15.56 | 18.16 | 17.27 | 14.2 | 14.17 | |
| Population, Hungary | 10657.42 | 10599 | 10529.28 | 10460.48 | 10404.83 | 10374.82 | 10373.15 | 10373.64 | 10365.04 | 10350.02 | 10336.7 | 10321.23 | 10301.24 | 10279.73 | 10253.42 | 10221.64 | 10200.3 | 10174.85 | 10142.36 | 10116.74 | 10097.55 | 10076.58 | 10057.88 | |
| Sources: | ||||||||||||||||||||||||
| 1 Population: national estimates at January 1st: Euromonitor International from national statistics/UN | ||||||||||||||||||||||||
| 2 Foreign citizens: Euromonitor International from trade sources/national statistics | ||||||||||||||||||||||||
| 3 Net migration: Euromonitor International from national statistical offices/UN | ||||||||||||||||||||||||
| exports, imports, trade balance | ||||||||||||||||||||||||
| Denmark | ||||||||||||||||||||||||
| 1985 | 1986 | 1987 | 1988 | 1989 | 1990 | 1991 | 1992 | 1993 | 1994 | 1995 | 1996 | 1997 | 1998 | 1999 | 2000 | 2001 | 2002 | 2003 | 2004 | 2005 | 2006 | |||
| Exports, Denmark | 17090.2 | 21285.6 | 25675.4 | 28502.4 | 29564.3 | 37037.2 | 37886.2 | 41675.7 | 38206.5 | 43120 | 51478.1 | 51479.9 | 49118.6 | 48839.2 | 50399.4 | 50380.2 | 51067.7 | 56303.5 | 65267 | 75619.9 | 83561.5 | 91710.3 | ||
| Imports, Denmark | 18245.3 | 22878.4 | 25498.6 | 27032.9 | 27801.4 | 33248.2 | 34057.2 | 35521.1 | 31330.6 | 36588.7 | 45728.1 | 45003.9 | 44406.3 | 46330.1 | 44519.3 | 44356 | 44123.8 | 48886.5 | 56216.5 | 66886.3 | 74258.9 | 85110.4 | ||
| Trade balance, Denmark | -1155.1 | -1592.8 | 176.8 | 1469.5 | 1762.9 | 3789 | 3829 | 6154.6 | 6875.9 | 6531.3 | 5750 | 6476 | 4712.3 | 2509.1 | 5880.1 | 6024.2 | 6943.9 | 7417 | 9050.5 | 8733.6 | 9302.6 | 6599.9 | ||
| Hungary | ||||||||||||||||||||||||
| 1985 | 1986 | 1987 | 1988 | 1989 | 1990 | 1991 | 1992 | 1993 | 1994 | 1995 | 1996 | 1997 | 1998 | 1999 | 2000 | 2001 | 2002 | 2003 | 2004 | 2005 | 2006 | |||
| Exports, Hungary | 8538.13 | 9165.43 | 9555.56 | 9949.37 | 10066.6 | 9597.78 | 10199.2 | 10663.5 | 8886.36 | 10434.2 | 12801.4 | 15631 | 18989.6 | 22991.6 | 24949.9 | 28015.9 | 30529.7 | 34511.6 | 42531.9 | 54892.3 | 62178.8 | 74216.4 | ||
| Imports, Hungary | 8223.68 | 9598.67 | 9841.47 | 9344.78 | 8709.07 | 8670.79 | 11417.3 | 11106.8 | 12468.4 | 14265.9 | 15379.5 | 18057.7 | 21115.4 | 25678.8 | 27922.8 | 31955.1 | 33724.5 | 37787.5 | 47601.6 | 59636.5 | 65783.3 | 77206.1 | ||
| Trade balance, Hungary | 314.45 | -433.24 | -285.91 | 604.59 | 1357.53 | 926.99 | -1218.1 | -443.3 | -3582.04 | -3831.7 | -2578.1 | -2426.7 | -2125.8 | -2687.2 | -2972.9 | -3939.2 | -3194.8 | -3275.9 | -5069.7 | -4744.2 | -3604.5 | -2989.7 | ||
| 1 Imports: Euromonitor International from International Monetary Fund (IMF), International Financial Statistics | ||||||||||||||||||||||||
| 2 Exports: Euromonitor International from International Monetary Fund (IMF), International Financial Statistics | ||||||||||||||||||||||||
| 3 Trade balance: Euromonitor International from International Monetary Fund (IMF), International Financial Statistics | ||||||||||||||||||||||||
| 1985 | 1986 | 1987 | 1988 | 1989 | 1990 | 1991 | 1992 | 1993 | 1994 | 1995 | 1996 | 1997 | 1998 | 1999 | 2000 | 2001 | 2002 | 2003 | 2004 | 2005 | 2006 | 2007 | ||
| Denmark | ||||||||||||||||||||||||
| 16548.53 | 20309.82 | 24422.14 | 26297.79 | 26929.39 | 33322.93 | 35899.17 | 41630.48 | 37619.8 | 42124.7 | 50388.43 | 50770.24 | 52648.49 | 52477.98 | 54440.82 | 55578.97 | 56172.04 | 61717.5 | 72761.77 | 83881.22 | 95725.13 | 107209.12 | - | ||
| - | - | - | - | 28046.2 | 34842.8 | 35713.06 | 39553.11 | 37170.99 | 41602.37 | 48789.13 | 48884.54 | 48800.43 | 47709.99 | 49027.81 | 49210.3 | 50977.56 | 55685.47 | 64613.99 | 74792.64 | 82415.35 | 90118.24 | 95222.66 | ||
| 17468.74 | 21851.59 | 24255.99 | 25136.31 | 25085.39 | 30433.99 | 31144.51 | 34819.43 | 30109.73 | 35095.09 | 43679.54 | 42532.84 | 46219.28 | 48174.57 | 48855.06 | 49898.28 | 49601.1 | 54200.42 | 62898.42 | 74660.6 | 85286.62 | 99492.54 | 110598.12 | ||
| - | - | - | - | 26618.14 | 31575.71 | 32169.42 | 33590.32 | 30535.71 | 35436.45 | 43141.53 | 43126.35 | 44492.34 | 45700.68 | 44316.61 | 44586.86 | 44631.17 | 49312.59 | 56230.43 | 66895.19 | 74265.07 | 84510.99 | 92917.65 | ||
| Hungary | ||||||||||||||||||||||||
| 5798.4 | 6431.9 | 6584.76 | 7361.61 | 6953.34 | 7398.89 | 9003.3 | 9431.9 | 7633 | 13149.6 | 16562.7 | 17324.82 | 24676.81 | 29526.43 | 30888.29 | 35177 | 38697.72 | 43444.85 | 55806.88 | 76422.63 | 91268.13 | 114996.49 | - | ||
| - | - | - | - | - | 9587.6 | 10186.9 | 10054.98 | 8240.06 | 10699.84 | 12452.02 | 12632.79 | 19099.19 | 23005.02 | 25012.19 | 28091.79 | 30497.74 | 34336.58 | 43007.78 | 55468.25 | 63240.57 | 74055.48 | 81272.78 | ||
| 6187.4 | 7138.98 | 7321.53 | 7307.9 | 6680.16 | 7093.43 | 9231.8 | 8619.7 | 9380.5 | 17210.3 | 18583 | 20029.38 | 26039.22 | 30927.84 | 33635.29 | 38989.2 | 41158.4 | 46540.5 | 60306.43 | 78658 | 89823.66 | 109767.26 | 120710.86 | ||
| - | - | - | - | - | 8646.5 | 11371.26 | 10873.58 | 11376.08 | 14553.61 | 15185.56 | 16042.64 | 21234.01 | 25706.39 | 28008.23 | 32079.45 | 33681.74 | 37611.57 | 46674.97 | 60248.67 | 66741.34 | 76978.58 | 83913.31 | ||
| Sources: | ||||||||||||||||||||||||
| 1 Foreign trade: Euromonitor International from trade sources/national statistics | ||||||||||||||||||||||||
| 2 Imports (cif) by origin: International Monetary Fund (IMF), Direction of Trade Statistics | ||||||||||||||||||||||||
| 3 Imports (cif) by commodity: United Nations, UN Trade Statistics | ||||||||||||||||||||||||
| 4 Exports (fob) by destination: International Monetary Fund (IMF), Direction of Trade Statistics | ||||||||||||||||||||||||
| 5 Exports (fob) by commodity: United Nations, UN Trade Statistics | ||||||||||||||||||||||||
| exports,imports by origin | ||||||||||||||||||||||||
| Denmark | ||||||||||||||||||||||||
| 1985 | 1986 | 1987 | 1988 | 1989 | 1990 | 1991 | 1992 | 1993 | 1994 | 1995 | 1996 | 1997 | 1998 | 1999 | 2000 | 2001 | 2002 | 2003 | 2004 | 2005 | 2006 | 2007 | ||
| Exports to Africa and the Middle East | 946.76 | 930.35 | 964.08 | 1170.47 | 1153.56 | 1650.44 | 1155.08 | 1686.62 | 1361.95 | 1634.94 | 1827.09 | 1407.98 | 1392.17 | 1410.42 | 1426.83 | 1332.85 | 1459.3 | 1639.89 | 1918.11 | 2119.83 | 2149.46 | 2002.33 | 2502.64 | |
| Exports to Asia-Pacific | 1055.57 | 1360.3 | 1863.53 | 2049.33 | 1969.42 | 2201.44 | 2350.54 | 2941.31 | 2868.25 | 3432.65 | 4304.39 | 4242.44 | 3897.13 | 3358.1 | 3692.14 | 3785.11 | 3855.94 | 4044.87 | 4916.76 | 5799.17 | 5925.29 | 6215.58 | 6257.59 | |
| Exports to Australasia | 143.16 | 141.92 | 162.89 | 183.35 | 213.15 | 195.66 | 182.6 | 212.89 | 229.78 | 282.5 | 317.66 | 331.2 | 339.31 | 326.85 | 371.68 | 368.58 | 358.91 | 426.7 | 565.37 | 823.29 | 751.11 | 855.18 | 1065.24 | |
| Exports to Europe, Denmark | 12120.82 | 15564.74 | 19129.26 | 20764.77 | 21475.94 | 27042.29 | 29839.11 | 33868.39 | 30340.04 | 33540.61 | 40812.41 | 41686.27 | 43736.32 | 44043.69 | 45220.04 | 45971.86 | 45871.88 | 50840.67 | 59964.08 | 69299.09 | 79726.2 | 90178.61 | 95408.43 | |
| Exports to EU-27, Denmark | 10011.43 | 12774 | 15816.75 | 17325.11 | 18221.29 | 22984.67 | 24352.63 | 27725.63 | 23572.72 | 25679.63 | 31307.92 | 31135.23 | 32839.48 | 32797.06 | 34490.85 | 36012.3 | 34961.19 | 38539.13 | 45475.03 | 52937.48 | 59639.18 | 65669.69 | 68871.65 | |
| Exports to Latin America | 360.12 | 336.91 | 292.83 | 348.5 | 361.96 | 352.46 | 615.55 | 852.88 | 740.72 | 835.92 | 952.35 | 862.75 | 824.94 | 799.31 | 720.11 | 791.5 | 734.78 | 763.61 | 762.39 | 895.23 | 982.31 | 1250.42 | 1198.89 | |
| Exports to USA | 1753.8 | 1796.25 | 1806.36 | 1589.21 | 1552.04 | 1700.2 | 1577.55 | 1882.94 | 1897.57 | 2185.27 | 1979.25 | 2032.93 | 2234.33 | 2263.84 | 2709.42 | 2994.22 | 3524.58 | 3569.16 | 4078.41 | 4379.78 | 5458.85 | 5778.21 | 7019.2 | |
| 1985 | 1986 | 1987 | 1988 | 1989 | 1990 | 1991 | 1992 | 1993 | 1994 | 1995 | 1996 | 1997 | 1998 | 1999 | 2000 | 2001 | 2002 | 2003 | 2004 | 2005 | 2006 | 2007 | ||
| Imports from Africa and the Middle East | 701.94 | 577.12 | 517.13 | 568.24 | 718.88 | 615.04 | 226.46 | 221.98 | 324.54 | 401.62 | 435.38 | 438.62 | 385.71 | 385.11 | 281.38 | 383.64 | 449.69 | 376.82 | 445.32 | 1032.44 | 1240.12 | 1018.84 | 741.62 | |
| Imports from Asia-Pacific | 1246.66 | 2023.24 | 2103.01 | 2230.99 | 2238.07 | 2735.05 | 2948.4 | 2870.83 | 2800.51 | 3365.31 | 3420.88 | 3321.99 | 3345.14 | 3521.7 | 3620.7 | 3803.75 | 3574.76 | 3765.01 | 5198.57 | 6528.32 | 7486.15 | 8507.46 | 9641.41 | |
| Imports from Australasia | 126.59 | 130.28 | 164.18 | 94.39 | 101.92 | 92.7 | 121.77 | 111.27 | 64.51 | 85.5 | 114.08 | 134.48 | 129.49 | 185.93 | 100.04 | 95.13 | 108.56 | 121.54 | 206.25 | 298.95 | 297.13 | 293.44 | 290.29 | |
| Imports from Europe, Denmark | 13719.41 | 17337.03 | 19541.31 | 20037.58 | 19482.56 | 24231.42 | 25068.33 | 28888.68 | 24732.42 | 28681.94 | 36807.26 | 35597.87 | 39090.2 | 40876.14 | 41966.32 | 42698.88 | 42503.87 | 47142.27 | 54190.53 | 63259.35 | 72745.07 | 85573.88 | 95170.63 | |
| Imports from EU-27 , Denmark | 11847.93 | 15119.29 | 16938 | 17251.97 | 16886.96 | 20723.34 | 21089.22 | 23810.06 | 19570.64 | 22465.24 | 29339.85 | 28056.12 | 31312.98 | 32597.66 | 33689.77 | 32917 | 32831.36 | 36936.74 | 42047.36 | 48508.5 | 53582.15 | 62099.2 | 68865.4 | |
| Imports from Latin America | 525.76 | 488.94 | 479.93 | 523.36 | 627.85 | 668.73 | 606.86 | 642.41 | 640.59 | 671.47 | 691.43 | 770.68 | 854.58 | 732.93 | 639.91 | 684.86 | 738.97 | 655.62 | 844.78 | 1046.61 | 1179.47 | 1225.86 | 1441.91 | |
| Imports from USA | 1074.85 | 1207.29 | 1350.91 | 1563.03 | 1778.96 | 1949.73 | 2011.93 | 1868.93 | 1417.15 | 1741.5 | 2058.38 | 2105.72 | 2242.96 | 2308.76 | 2018.14 | 1939.78 | 1964.76 | 1910.47 | 1827.72 | 2265.09 | 2064.45 | 2563.35 | 2650.81 | |
| Hungary | ||||||||||||||||||||||||
| 1985 | 1986 | 1987 | 1988 | 1989 | 1990 | 1991 | 1992 | 1993 | 1994 | 1995 | 1996 | 1997 | 1998 | 1999 | 2000 | 2001 | 2002 | 2003 | 2004 | 2005 | 2006 | 2007 | ||
| Exports to Africa and the Middle East | 685.78 | 470.92 | 452.91 | 539.66 | 441.29 | 416.32 | 483.9 | 337.8 | 258.8 | 204.3 | 385.4 | 318.2 | 312.09 | 321.13 | 260.75 | 306.2 | 380.03 | 579.28 | 1060.63 | 1376.06 | 1987.79 | 2496.7 | 2612.63 | |
| Exports to Asia-Pacific | 231.69 | 336.64 | 345 | 542.42 | 469.65 | 471.18 | 415.2 | 270.6 | 287.2 | 245 | 249.1 | 314.53 | 368.67 | 432.51 | 583.02 | 667.9 | 729.08 | 863.9 | 864.72 | 1262.16 | 1590.17 | 2395.77 | 2610.18 | |
| Exports to Australasia | 5.94 | 10.46 | 13.73 | 25.53 | 22.28 | 19.03 | 21.9 | 20.2 | 20.1 | 22 | 22.7 | 23.17 | 23.36 | 24.25 | 27.67 | 29.1 | 26.83 | 105.48 | 57.02 | 78.31 | 102.29 | 140.11 | 151.89 | |
| Exports to Europe, Hungary | 4528.43 | 5238.41 | 5340.3 | 5821.99 | 5558.88 | 6049.16 | 7627.7 | 8363.4 | 6626.8 | 12164.6 | 15417.3 | 16111.21 | 23239.31 | 27464.48 | 28530.58 | 32501.9 | 35858.59 | 40467.38 | 52247.7 | 71725.54 | 85301.03 | 107427.79 | 123281.3 | |
| Exports to EU-27, Hungary | 2499.69 | 2850.56 | 3150.48 | 3575.78 | 3691.71 | 4611.4 | 6188.2 | 6798.8 | 5198.1 | 7649.6 | 9295.3 | 9537.49 | 15468.55 | 18979.6 | 20976.69 | 23506.1 | 25298.73 | 28671.01 | 35698.04 | 46004.05 | 50838.35 | 59682.07 | 67571.99 | |
| Exports to Latin America | 119.4 | 121.8 | 104.11 | 93.81 | 106.52 | 74.75 | 100.4 | 48.5 | 41.7 | 48.1 | 53.5 | 70.75 | 77.34 | 175.98 | 154.25 | 157.8 | 164.97 | 184.92 | 169.49 | 262.04 | 306.19 | 348.06 | 341.86 | |
| Exports to USA | 197.08 | 214.4 | 286.96 | 293.63 | 318.71 | 339.53 | 322.5 | 343 | 373.5 | 430.5 | 413.1 | 464.33 | 618.62 | 1045.28 | 1298.67 | 1475 | 1495.25 | 1180.83 | 1342.31 | 1649.49 | 1892.89 | 2048.41 | 1843.46 | |
| 1985 | 1986 | 1987 | 1988 | 1989 | 1990 | 1991 | 1992 | 1993 | 1994 | 1995 | 1996 | 1997 | 1998 | 1999 | 2000 | 2001 | 2002 | 2003 | 2004 | 2005 | 2006 | 2007 | ||
| Imports from Africa and the Middle East | 183.48 | 113.18 | 181.83 | 154.71 | 71.55 | 345.92 | 370.4 | 49.5 | 50.4 | 83.2 | 141.9 | 203.97 | 177.88 | 201.24 | 196.14 | 200.1 | 236.07 | 207.38 | 227.47 | 141.69 | 174.8 | 180.83 | 284.62 | |
| Imports from Asia-Pacific | 323.96 | 506.75 | 544.53 | 522.94 | 464.8 | 488.09 | 637.6 | 494.9 | 657.3 | 783.5 | 841.3 | 1038.56 | 1919.81 | 2791.53 | 3293.7 | 4807.9 | 5156.75 | 6592.94 | 8676.99 | 8092.44 | 10365.59 | 11347.47 | 12252.41 | |
| Imports from Australasia | 31.56 | 14.82 | 13.23 | 19.71 | 12.82 | 8.61 | 371.2 | 7.5 | 5.6 | 5.2 | 6.6 | 14.41 | 18.08 | 27.26 | 20.28 | 25.4 | 32.17 | 24.93 | 45.67 | 36.78 | 20.89 | 17.94 | 39.53 | |
| Imports from Europe, Hungary | 5160.33 | 6096.77 | 6133.86 | 6105.05 | 5679.02 | 5796.14 | 7347.2 | 7541.9 | 7964.2 | 15658.6 | 16845.7 | 17909.72 | 22719.36 | 26392.14 | 28653.75 | 32232.9 | 33854.66 | 37798.42 | 49155.56 | 69073.59 | 77695.01 | 96719.45 | 106430.93 | |
| Imports from EU-27, Hungary | 3006.43 | 3554.95 | 3742.55 | 3778.36 | 3837.83 | 4425.68 | 6028.5 | 6350.6 | 6774.8 | 9714.6 | 10372 | 10714.35 | 14897.64 | 18307.48 | 20018.74 | 21226.2 | 22102.44 | 24241.35 | 30678.81 | 43620.6 | 46434.01 | 55031.83 | 60937.03 | |
| Imports from Latin America | 218.61 | 200.01 | 182.61 | 285.47 | 222.49 | 216.28 | 184.8 | 165 | 169.5 | 194.1 | 223.8 | 246.69 | 318 | 416.87 | 442.87 | 422.8 | 400.47 | 442.79 | 548.53 | 240.9 | 331.82 | 282.2 | 257.84 | |
| Imports from USA | 244.98 | 194.24 | 251.26 | 210.01 | 221.8 | 227.94 | 299.4 | 322.7 | 500.4 | 451.7 | 481.7 | 568.89 | 797.73 | 992.82 | 965.07 | 1223.7 | 1410.18 | 1373.19 | 1524.1 | 988.66 | 1095.37 | 1105.18 | 1312.54 | |
| Sources: | ||||||||||||||||||||||||
| 1 Imports (cif) from Asia-Pacific: International Monetary Fund (IMF), Direction of Trade Statistics | ||||||||||||||||||||||||
| 2 Imports (cif) from USA: International Monetary Fund (IMF), Direction of Trade Statistics | ||||||||||||||||||||||||
| 3 Exports (fob) to Asia-Pacific: International Monetary Fund (IMF), Direction of Trade Statistics | ||||||||||||||||||||||||
| 4 Exports (fob) to USA: International Monetary Fund (IMF), Direction of Trade Statistics | ||||||||||||||||||||||||
| 5 Exports (fob) to Latin America: Euromonitor International from trade sources/national statistics | ||||||||||||||||||||||||
| 6 Imports (cif) from Latin America: Euromonitor International from trade sources/national statistics | ||||||||||||||||||||||||
| 7 Imports (cif) from Europe: Euromonitor International from trade sources/national statistics | ||||||||||||||||||||||||
| 8 Exports (fob) to Europe: Euromonitor International from trade sources/national statistics | ||||||||||||||||||||||||
| 9 Imports (cif) from Australasia: Euromonitor International from trade sources/national statistics | ||||||||||||||||||||||||
| 10 Exports (fob) to Australasia: Euromonitor International from trade sources/national statistics | ||||||||||||||||||||||||
| 11 Exports (fob) to Africa and the Middle East: Euromonitor International from trade sources/national statistics | ||||||||||||||||||||||||
| 12 Imports (cif) from Africa and the Middle East: Euromonitor International from trade sources/national statistics | ||||||||||||||||||||||||
| 13 Imports (cif) from EU-27: Euromonitor International from trade sources/national statistics | ||||||||||||||||||||||||
| 14 Exports (fob) to EU-27: Euromonitor International from trade sources/national statistics | ||||||||||||||||||||||||
| exports, imports by commodity | ||||||||||||||||||||||||
| Denmark | ||||||||||||||||||||||||
| 1989 | 1990 | 1991 | 1992 | 1993 | 1994 | 1995 | 1996 | 1997 | 1998 | 1999 | 2000 | 2001 | 2002 | 2003 | 2004 | 2005 | 2006 | 2007 | ||||||
| Exports of food and live animals | 7200.95 | 8721.86 | 9070.13 | 9683.81 | 8980.06 | 9803.91 | 10867.2 | 10455.51 | 10632.09 | 9992.92 | 9455.12 | 8963.19 | 9592.5 | 9943.41 | 11348 | 12658.8 | 13190.44 | 14542.7 | 15013.02 | |||||
| Exports of beverages and tobacco | 288.91 | 369.2 | 390.33 | 422.76 | 412.03 | 430.59 | 539.46 | 483.66 | 492.12 | 479.83 | 470.76 | 545.23 | 475.19 | 614.87 | 821.56 | 874.91 | 880.33 | 965.79 | 989.35 | |||||
| Exports of crude materials exc. fuels | 1511.47 | 1636.85 | 1544.71 | 1538.25 | 1292.71 | 1460.76 | 1760.43 | 1779.35 | 1776.86 | 1598.52 | 1502.94 | 1490.19 | 1571.8 | 1902.65 | 2297.19 | 2712.96 | 2745.1 | 3289.39 | 3569.5 | |||||
| Exports of mineral fuels | 843.95 | 1163.87 | 1287.91 | 1356.07 | 1095.3 | 1033.55 | 1260.46 | 2097.24 | 1827.83 | 1310.49 | 1846.62 | 3450.36 | 2917.97 | 3441.58 | 4234.03 | 5869.14 | 7751.65 | 9237.32 | 10563.68 | |||||
| Exports of oils and fats | 133.06 | 151.5 | 146.93 | 165.96 | 139.79 | 189.22 | 278.79 | 264.11 | 278.71 | 263.62 | 232.01 | 181.76 | 191.87 | 223.02 | 272.06 | 366.89 | 418.78 | 478.23 | 521.07 | |||||
| Exports of chemicals | 2466.72 | 2951.75 | 2997.33 | 3571.56 | 3386.17 | 3807.33 | 4725.03 | 4691.39 | 5007.01 | 4788.7 | 5405.76 | 5378.63 | 6080.82 | 6809.58 | 8548.54 | 9623.99 | 10850.25 | 10964.25 | 11093.15 | |||||
| Exports of basic manufactures | 3102.16 | 3863.75 | 3876.41 | 4227.63 | 3691.52 | 4137.32 | 5256.56 | 5028.82 | 5265.22 | 5291.12 | 5421.68 | 5161.9 | 5145.62 | 5526.11 | 6471.07 | 7408.41 | 7824.54 | 9152.66 | 9769.61 | |||||
| Exports of machinery and transport equipment | 7033.82 | 9196.7 | 9029.22 | 10447.73 | 8981.59 | 10267.63 | 12260 | 12490 | 13158.32 | 13184.6 | 13682.95 | 13027.43 | 13983.45 | 16356.54 | 17829.6 | 20658.27 | 23176.97 | 24871.01 | 26412.85 | |||||
| Exports of miscellaneous manufactured goods | 4029.24 | 5122.99 | 5495.67 | 6138.08 | 5587.75 | 6089.86 | 7192.77 | 7020.28 | 7610.95 | 7953.47 | 8186.57 | 8266.84 | 8248.24 | 8660.25 | 10371.73 | 11872.98 | 12461.16 | 13815.02 | 14449.52 | |||||
| Exports of other goods | 1435.92 | 1664.34 | 1874.42 | 2001.26 | 3604.07 | 4382.2 | 4648.42 | 4574.18 | 2751.32 | 2846.73 | 2823.41 | 2744.75 | 2770.09 | 2207.46 | 2420.21 | 2746.29 | 3116.13 | 2801.86 | 2840.91 | |||||
| 1989 | 1990 | 1991 | 1992 | 1993 | 1994 | 1995 | 1996 | 1997 | 1998 | 1999 | 2000 | 2001 | 2002 | 2003 | 2004 | 2005 | 2006 | 2007 | ||||||
| Imports of food and live animals | 2798.28 | 3215.57 | 3420.19 | 3750.91 | 3471.02 | 3729.09 | 4310.89 | 4383.43 | 4587.06 | 4593.55 | 4440.47 | 4222.63 | 4276.3 | 4749.94 | 5654.87 | 6495.11 | 6963.06 | 7780.22 | 8400.01 | |||||
| Imports of beverages and tobacco | 305.21 | 374.71 | 387.58 | 438.29 | 432.56 | 451.79 | 546.4 | 574.35 | 696.92 | 635.87 | 647.34 | 588.83 | 599.84 | 678.56 | 830.96 | 926.03 | 941.07 | 1034.05 | 1113.04 | |||||
| Imports of crude materials exc. fuels | 1167.22 | 1238.93 | 1133.85 | 1231.34 | 1052.96 | 1345.09 | 1609.4 | 1478.74 | 1693.53 | 1692.57 | 1555.88 | 1466.47 | 1490.22 | 1589.2 | 1902.72 | 2064.78 | 2020.98 | 2456.58 | 2685.42 | |||||
| Imports of mineral fuels | 1922.46 | 2203.22 | 1694.27 | 1596.23 | 1534.07 | 1469.1 | 1436.07 | 1648.89 | 1700.64 | 1301.8 | 1361.98 | 2522.51 | 1826.47 | 2166.49 | 2656.49 | 3565.85 | 5009.25 | 4983.65 | 5259.96 | |||||
| Imports of oils and fats | 149.53 | 152.06 | 149.04 | 187.49 | 163.81 | 188.05 | 229.34 | 246.87 | 266.16 | 302.83 | 220.71 | 182.73 | 208.07 | 234.53 | 287.21 | 365.5 | 415.87 | 508.48 | 550.97 | |||||
| Imports of chemicals | 3013.89 | 3609.71 | 3572.03 | 3875.41 | 3394.21 | 3841.75 | 4821.33 | 4466.65 | 4693.86 | 4725.92 | 4500.65 | 4384.11 | 4598.01 | 5245.64 | 6194.44 | 7318.08 | 8096.08 | 9118.75 | 9980.04 | |||||
| Imports of basic manufactures | 5289.27 | 6187.39 | 6052.39 | 6467.16 | 5135.23 | 6091.51 | 7901.57 | 7097.92 | 7679.18 | 7948.82 | 7360.49 | 7209.07 | 7320.7 | 7698.29 | 9041.77 | 11050.22 | 11996.5 | 14203.3 | 15490.07 | |||||
| Imports of machinery and transport equipment | 8021.22 | 9969.16 | 10132.44 | 10027.87 | 8938.66 | 11032.67 | 13821.51 | 14000.15 | 14989.57 | 16115 | 15873.59 | 16020.15 | 15804.83 | 18557.24 | 19913.06 | 24121.56 | 26965.95 | 30677.13 | 34399.99 | |||||
| Imports of miscellaneous manufactured goods | 3252.66 | 3890.41 | 4244.35 | 4630.96 | 4182.53 | 4675.98 | 5495.78 | 5644.06 | 6626.88 | 6976.3 | 7127.16 | 6812.11 | 6955.09 | 7324.57 | 8725.54 | 9741.39 | 10713.57 | 12538.79 | 13750.01 | |||||
| Imports of other goods | 698.39 | 734.55 | 1383.27 | 1384.65 | 2230.65 | 2611.42 | 2969.24 | 3585.29 | 1558.54 | 1408.03 | 1228.35 | 1178.25 | 1551.65 | 1068.14 | 1023.36 | 1246.68 | 1142.74 | 1210.04 | 1288.14 | |||||
| Hungary | ||||||||||||||||||||||||
| 1989 | 1990 | 1991 | 1992 | 1993 | 1994 | 1995 | 1996 | 1997 | 1998 | 1999 | 2000 | 2001 | 2002 | 2003 | 2004 | 2005 | 2006 | 2007 | ||||||
| Exports of food and live animals | - | 1901.3 | 2258.1 | 2081.83 | 1415.37 | 1728.49 | 2256.91 | 2050.81 | 2195.15 | 2169.95 | 1825.5 | 1802.17 | 2145.96 | 2202.93 | 2650.98 | 3163.74 | 3356.22 | 3693.76 | 3963.81 | |||||
| Exports of beverages and tobacco | - | 129.1 | 93.2 | 143.9 | 188.76 | 192.03 | 258.75 | 323.62 | 224.75 | 202.22 | 150.75 | 102.99 | 101.65 | 109.17 | 138.3 | 155.65 | 144.62 | 187.08 | 191.71 | |||||
| Exports of crude materials exc. fuels | - | 455.2 | 632 | 556.05 | 494.5 | 523.27 | 595.81 | 573.3 | 523.64 | 500.66 | 483.58 | 562.06 | 527.58 | 613.19 | 768.83 | 1082.63 | 1086.32 | 1139.3 | 1177 | |||||
| Exports of mineral fuels | - | 296.3 | 298.1 | 326.41 | 307.67 | 367.59 | 383.8 | 427.06 | 432.8 | 424.47 | 397.54 | 453.21 | 483.73 | 510.42 | 689.96 | 1041.27 | 1619.58 | 1731.87 | 1797.13 | |||||
| Exports of oils and fats | - | 113 | 122.9 | 108.13 | 87.87 | 91.03 | 52.11 | 54.98 | 170.44 | 139.14 | 88.27 | 50.81 | 39.71 | 41.29 | 86.26 | 118.19 | 131.05 | 137.2 | 142.77 | |||||
| Exports of chemicals | - | 1191.2 | 1285.9 | 946.9 | 908.18 | 1048.58 | 1434.27 | 1312.1 | 1473.08 | 1466.48 | 1424.23 | 1709.09 | 1864.91 | 2118.06 | 2878.3 | 4118.42 | 4784.78 | 5739.08 | 6404.82 | |||||
| Exports of basic manufactures | - | 1769.8 | 1671.2 | 1594.61 | 1278.15 | 1591 | 2150.2 | 2265.96 | 2423.64 | 2741.83 | 2765.88 | 2945.37 | 3134.88 | 3471.27 | 4423.18 | 5626.33 | 6340.56 | 7070.57 | 7715.29 | |||||
| Exports of machinery and transport equipment | - | 2459 | 2255.3 | 2152.46 | 2004.86 | 2435.08 | 3247.64 | 3287.58 | 8575.9 | 11927.49 | 14283.64 | 16760.07 | 17509.78 | 20128.49 | 26260.55 | 34647 | 37180.61 | 44308.72 | 49003.66 | |||||
| Exports of miscellaneous manufactured goods | - | 1026 | 1560.3 | 2144.32 | 1549.06 | 1892.49 | 2068.84 | 2330.8 | 2560.38 | 3016.89 | 3232.43 | 3244.33 | 3899.04 | 4420.5 | 4547.6 | 5301.36 | 5528.27 | 5951.89 | 6295.29 | |||||
| Exports of other goods | - | 246.7 | 9.9 | 0.37 | 5.64 | 830.29 | 3.7 | 6.57 | 519.42 | 415.89 | 360.36 | 461.68 | 790.49 | 721.27 | 563.82 | 213.67 | 3068.56 | 4096.03 | 4581.32 | |||||
| 1989 | 1990 | 1991 | 1992 | 1993 | 1994 | 1995 | 1996 | 1997 | 1998 | 1999 | 2000 | 2001 | 2002 | 2003 | 2004 | 2005 | 2006 | 2007 | ||||||
| Imports of food and live animals | - | 548 | 543.66 | 511.03 | 618.09 | 811.66 | 716.17 | 690.05 | 772.63 | 832.99 | 730.99 | 800.04 | 881.47 | 1022.79 | 1330.5 | 2001.95 | 2192.75 | 2544.72 | 2813.91 | |||||
| Imports of beverages and tobacco | - | 69.5 | 84.06 | 80.51 | 55.78 | 92.2 | 79.01 | 99.64 | 103.43 | 101.21 | 101.15 | 67.81 | 76.18 | 86.69 | 120.48 | 218.39 | 184.8 | 338.19 | 395.05 | |||||
| Imports of crude materials exc. fuels | - | 454 | 620.11 | 411.15 | 359.55 | 526.72 | 612.58 | 575.06 | 542.95 | 563.47 | 522.24 | 625.44 | 550.83 | 638.05 | 852.5 | 1025.75 | 985.78 | 1073.34 | 1163.95 | |||||
| Imports of mineral fuels | - | 1229 | 1721.92 | 1662.57 | 1669.94 | 1715.96 | 1800.67 | 2194.14 | 1946.63 | 1616.14 | 1623.03 | 1508.33 | 1808.16 | 2771.57 | 2655.21 | 4357.54 | 4327.55 | 5716.48 | 6480.02 | |||||
| Imports of oils and fats | - | 8.9 | 14.2 | 10.38 | 15.33 | 18.08 | 41.13 | 42.86 | 99.28 | 118.54 | 45.4 | 47.74 | 52.41 | 63.87 | 80.14 | 88.51 | 94.53 | 86.62 | 89.25 | |||||
| Imports of chemicals | - | 1291.4 | 1419.65 | 1413.83 | 1474.84 | 1840.92 | 2195.83 | 2238.36 | 2404.57 | 2610.21 | 2664.43 | 2841.37 | 3004.84 | 3420.35 | 4596.74 | 5705.65 | 5849.27 | 6998.09 | 7719.94 | |||||
| Imports of basic manufactures | - | 1340.9 | 2170.94 | 2242.69 | 2269.81 | 2871.58 | 3538.03 | 3595.38 | 4186.8 | 4915.15 | 4956.67 | 5308.23 | 5476.57 | 6131.07 | 7648.67 | 9627.2 | 9127.04 | 10662.37 | 11770.04 | |||||
| Imports of machinery and transport equipment | - | 2992.3 | 3501.22 | 3201.17 | 3576.33 | 4505.49 | 4568.29 | 4889.95 | 8787.25 | 11892.36 | 13977.33 | 16366.12 | 17312.56 | 19406.01 | 24488.96 | 31890.49 | 32615.73 | 36684.22 | 39399.9 | |||||
| Imports of miscellaneous manufactured goods | - | 673.8 | 1294.73 | 1338.97 | 1335.82 | 1583.08 | 1633.85 | 1715.01 | 2072.81 | 2714.71 | 3050.67 | 3142.2 | 3186.72 | 3539.12 | 4494.4 | 5068.6 | 4829.25 | 5034.7 | 5241.2 | |||||
| Imports of other goods | - | 38.7 | 0.78 | 1.26 | 0.58 | 587.92 | 0 | 2.2 | 317.64 | 341.6 | 336.33 | 1372.18 | 1332.01 | 532.05 | 407.37 | 264.6 | 6534.63 | 7839.85 | 8840.05 | |||||
| Sources: | ||||||||||||||||||||||||
| 1 Imports (cif) of food and live animals, SITC classification 0: United Nations, UN Trade Statistics | ||||||||||||||||||||||||
| 2 Imports (cif) of beverages and tobacco, SITC classification 1: United Nations, UN Trade Statistics | ||||||||||||||||||||||||
| 3 Imports (cif) of crude materials exc. fuels, SITC classification 2: United Nations, UN Trade Statistics | ||||||||||||||||||||||||
| 4 Imports (cif) of mineral fuels, SITC classification 3: United Nations, UN Trade Statistics | ||||||||||||||||||||||||
| 5 Imports (cif) of oils and fats, SITC classification 4: United Nations, UN Trade Statistics | ||||||||||||||||||||||||
| 6 Imports (cif) of chemicals, SITC classification 5: United Nations, UN Trade Statistics | ||||||||||||||||||||||||
| 7 Imports (cif) of basic manufactures, SITC classification 6: United Nations, UN Trade Statistics | ||||||||||||||||||||||||
| 8 Imports (cif) of machinery and transport equipment, SITC classification 7: United Nations, UN Trade Statistics | ||||||||||||||||||||||||
| 9 Imports (cif) of miscellaneous manufactured goods, SITC classification 8: United Nations, UN Trade Statistics | ||||||||||||||||||||||||
| 10 Imports (cif) of other goods, SITC classification 9: United Nations, UN Trade Statistics | ||||||||||||||||||||||||
| 11 Exports (fob) of food and live animals, SITC classification 0: United Nations, UN Trade Statistics | ||||||||||||||||||||||||
| 12 Exports (fob) of beverages and tobacco, SITC classification 1: United Nations, UN Trade Statistics | ||||||||||||||||||||||||
| 13 Exports (fob) of crude materials exc. fuels, SITC classification 2: United Nations, UN Trade Statistics | ||||||||||||||||||||||||
| 14 Exports (fob) of mineral fuels, SITC classification 3: United Nations, UN Trade Statistics | ||||||||||||||||||||||||
| 15 Exports (fob) of oils and fats, SITC classification 4: United Nations, UN Trade Statistics | ||||||||||||||||||||||||
| 16 Exports (fob) of chemicals, SITC classification 5: United Nations, UN Trade Statistics | ||||||||||||||||||||||||
| 17 Exports (fob) of basic manufactures, SITC classification 6: United Nations, UN Trade Statistics | ||||||||||||||||||||||||
| 18 Exports (fob) of machinery and transport equipment, SITC classification 7: United Nations, UN Trade Statistics | ||||||||||||||||||||||||
| 19 Exports (fob) of miscellaneous manufactured goods, SITC classification 8: United Nations, UN Trade Statistics | ||||||||||||||||||||||||
| 20 Exports (fob) of other goods, SITC classification 9: United Nations, UN Trade Statistics |