The First Quarter Philippine Economic Report DemystifiedThings are looking up! Maybe.
Marching through BramblesThe National Statistics Coordination Board (NSCB) is the main branch of the Philippine Government that monitors and collects data of about economic, social & environmental indicators as well as some data about governance in the country. It meticulously collects raw and accurate data and then proceeds to interpret them into a manageable data sets. Their office comes up with a report to be mashed and masticated by various sectors with vested interest in our economy. The first quarter, 2007 economic performance was as succinct as it was uncomplicated. Which is to say not all. We will now attempt to express them in common terms so that everyone can relate to the data. All comparisons or analysis here were calculated at Constant 1985 Prices unless specified. The reason for this is to discount inflation and to get a more accurate view of the growth of our economy.
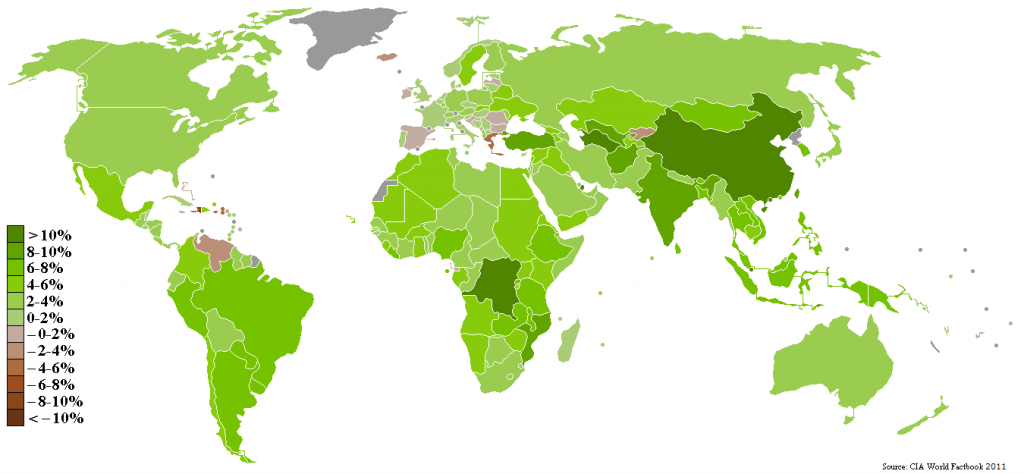 World map showing GDP real growth rates for 2010. ...
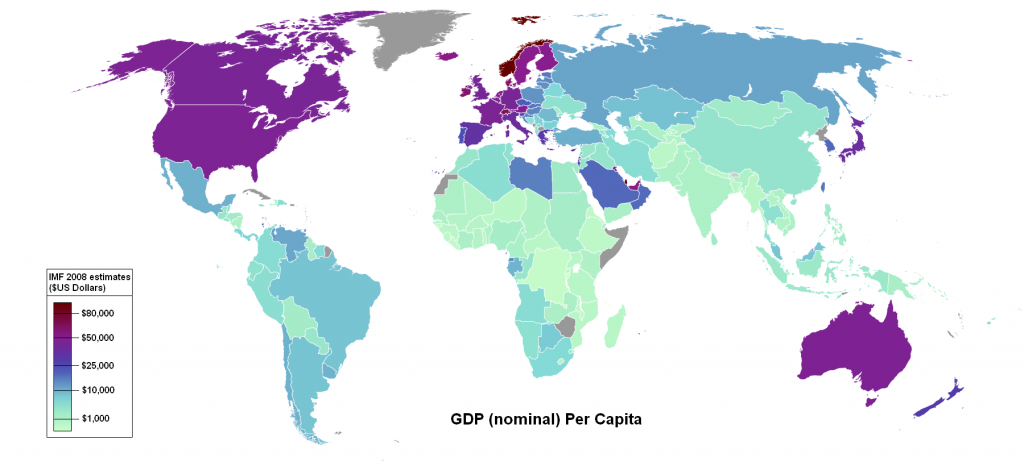 World map showing countries by nominal GDP per cap...
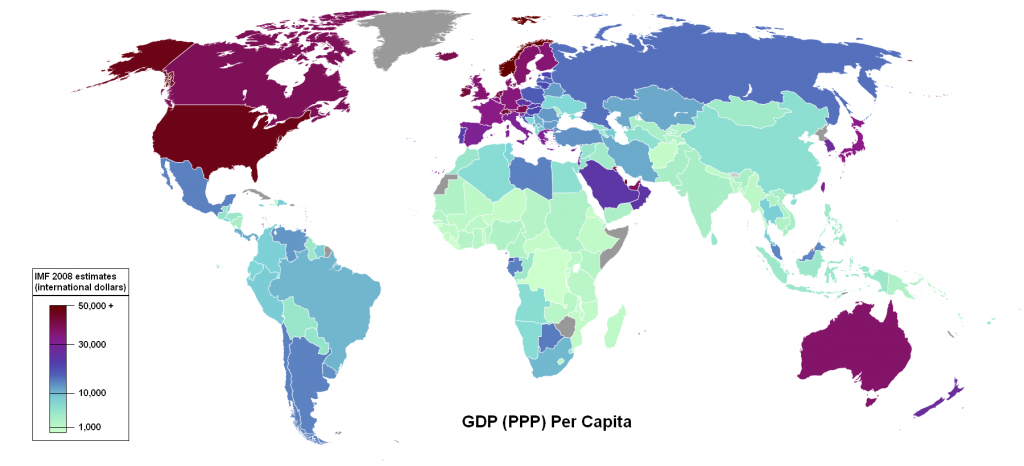 GDP (PPP) Per Capita based on 2008 estimates http:...
We will discuss this further on as we go along. Also all figures unless stated are from the 2007 first quarter NSCB reports.
GDPThere are key indicators that economists look for in determining how the country is faring economically. One of these indicators is the GDP or Gross Domestic Product. GDP measures the total income earned domestically, including the foreign-owned factors of production or the total expenditure on domestically produced goods and services. These two definitions are representative to the two approaches to computing GDP. To differentiate it from Gross National Product (GNP), GNP is the total income of all residents of a nation, including the countryÃÂs income from factors of production abroad. It can also be defined as the total expenditure on the nationÃÂs output of goods and services here and abroad.
Using the Income Approach in computing gross value added to each of the industries, the first quarter GDP as compared to last yearÃÂs GDP grew by a total of 6.9%, the highest recorded growth in seventeen years. The source of the growth can be easily determined by breaking the GDP into the industries that compose it. These are Agricultural, Fishery and Forestry (AFF); Industrial, and Service Sector. The source of the growth comes in analyzing their respective growth. The biggest growth is evident in the Service Sector, which experienced a 9.1% growth representing about 13.1 billion in increased value added contribution in the GDP. The Service Sector, in totality, represents about 49% of the first quarter 2007 GDP. The Industrial Sector experienced a 5.35% growth and the AFF Sector experienced a 4.17% growth. Both represent about 31.3% and 19.7% of the total GDP, respectively. (See Appendices A and B)The Service sector is composed of Transport, Communication and Storage (TCS); Trade; Finance; Occupied Dwellings and Real Estate (ODRE); Private Services; and Government Services. Among these sub sectors, Trade has the greatest contribution to the growth of the Service sector. In fact it has the highest growth among the sub sectors in all industries with an increased value added income of over Php 4.2 Billion. Following this is the TCS sub sector, which has 8.96%, Private Sectors with 8.66%, Finance with 6.11%, ODRE with 4.75%, and Government Services with 4.66%, in terms of GDP contribution. In terms of growth, and compared to the other sub sectors, finance has the greatest positive displacement. The Financial industry experienced a 13.43% growth.
The Industrial Sector is composed of Mining and Quarrying; Manufacturing; Construction; and Electricity, Gas, and Water (EGW). The Manufacturing side contributed to the bulk of the Industrial Sector amounting to Php 74,024 billion, which was about 73.63% of the whole Sector. In fact it has the highest GDP contribution in all the sub sectors and represents 23.08% of the countryÃÂs productivity. The other Industrial sub sectors grew at a slower rate with Mining and quarrying at 11%, manufacturing at 4.6%, construction at 8.6% & EGW at 4.1% growth. This was, of course compared the first quarter report of last years GDP.
Agricultural, Fisheries and Forestry experienced the smallest growth among the industries and also represents the smallest percent of the GDP in totality. Among the three sub sectors, the agricultural industry has the highest representation of about 15.08% of the GDP followed by the Fishery Industry with a 4.52% and then Forestry with a 0.08% contribution. The Corn industry contributed the highest contribution growth in the Agricultural Sector, followed by other crops and ÃÂpalay.ÃÂ Forestry grew by the largest margin at 25.7% but since it represents only a small part of AFF, its contribution is negligible. Considering that we still call ourselves an agricultural country, our national output in agriculture is too small. We should either pool our resources to improve this industry, if we still hope to call our country an agricultural one, or scrap the appellation and just maximize the service sector.
The most notable contribution as well as growth is the Trade, which was boosted by the expansion of the retail industry that virtually doubled. The stated cause of this is the opening of new malls and department stores in the previous years. In relation, the manufacturing industry contributes the biggest share of the GDP among the sub sectors and also the 2nd biggest growth contribution. It seems that people are spending more on retail or consumption expenditure. We will expound on this later on.
Now we take a look at the computation of GDP using the total expenditures consolidating each type. The types of expenditure include Personal Consumption Expenditure, Government Consumption, Capital Formation & Exports less Imports. Statistical discrepancy is also usually added but this only comprise the difference between the computation using the Income Approach and the Expenditure Approach. Personal Consumption Expenditure is the total purchases of goods and services purchased by the consumers. In the first quarter report, consumer spending increased by 5.9% compared to 5.3% last year. There was almost a Php 13.5 billion increase in consumer expenditure and this was material because it represents a little more than 75% of the total GDP. As we earlier stated people are spending more and more on retail products and consumption. This further reinforces our earlier observation. The bulk of the consumption expenditure is comprised of Food Expenditures at 53.1%. Other expenditures include clothing and footwear, tobacco, fuel, light and water.
Government Expenditure is comprised of goods and services purchased by our national and local government. The growth figure on this was pegged at 13.1%, which was significantly more than the 7.6% growth last year. According to the PSE website, government expenditure on infrastructure increased in the past few years. This can explain part of the increase in this yearÃÂs expenditure.
Capital Formation Expenditure represents the purchases of real estate & capital goods of firms. Capital expenditure grew by only Php 347 Million, which was a .6% growth. Capital Expenditure represented 17.6% of the total GDP, which was relatively small. A significant increase in the Water Transport industry was recorded. It experienced a 447% increase in growth from 47.9%. This major increase was somewhat offset by the drop in expenditures in the Sugar mill Machineries which recorded a -91.4% growth from 201.8% of last year.
Our exports grew at a slower pace this year at only 9.1% compared to the 13% growth last year. This can be attributed to the contraction of the Semiconductors and electronic microcircuits industry, which experienced a 553 million-Peso drop in output. This can probably experience a positive change with the 1 billion-dollar investment by Texas Instruments, the number 1 producer of semi-conductors in the world. ItÃÂs interesting that most people think that our number one export is coconut but coconut crude oil comprises 1.65% or our total merchandise export. Our biggest export is also the semiconductors and electronic microcircuits, which comprise 17.24% of our total merchandise export.
Imports are the purchases of foreign goods and services by domestic consumers, firms and the government. From the first quarter of 2006, which amounted to Php 148.796 billion, imports declined to Php 145.093 billion in the first quarter of this year. The first quarter net-exports (exports less imports) of 2006 was ÃÂ6.493 billion pesos compared to this yearÃÂs first quarter, which was 10.193 billion pesos. The increase in net-exports can be attributed to the relative increase in the semi conductor manufacturing increase.
NET FACTOR INCOME FROM ABROADThe total Inflow during the first quarter of 2007 grew by 11.6% when compared with the first quarter of 2006. This was due to an increase in compensation contribution despite the decline in property income contribution during the same period. The total Outflow, which was equal to the property expense contribution, also grew by 25.74%.
The Net Factor Income from Abroad (NFIA), which was total Inflow less total Outflow, grew by 3.83% in the first quarter of 2007. However, this represents a relatively low growth rate in comparison to the first quarter 2006 growth rate of 13.4%.
GNPThe reduced growth rate of the NFIA was the primary cause of the slow down of the growth of the Gross National Product from 13.4% last year to only 3.8% this year. This was the lowest recorded growth in over two years.
LABOR AND EMPLOYMENTAnother economic indicator was about employment. The data on labor and employment were based on the Labor Force Survey conducted on quarterly rounds by the National Statistics Office. All of the employment statistics were computed based on the old definition of employment except for the second quarter (April) survey of 2005 in which NSO used the new definition.
For purposes of computing the employment statistics, the adult population is defined as those who are 15 years old and over. The adult population is composed of those who are in the labor force and those who are not. The labor force is divided into Employed and Unemployed. Those who are employed are subdivided into Underemployed and Not Underemployed. The Underemployed category is further classified into visibly underemployed (that is, those who are ascertained to be working less than 40 hours each week) and invisibly underemployed.
The Labor Force Participation rate for the January 2007 quarterly survey is at 64.8%. This was a result of a low fluctuation of the inflation rate since January of last year. This latest rate was also the highest among first quarter survey data since 1999. (See Appendix C)The employment rate for the January 2007 first quarter survey was at 92.2%, that was, an improvement of 0.3% over the first quarter of 2006. Unemployment rate for January 2007 dropped to 7.8% as compared to the January 2006 rate of 8.1%. Both of these were also much lower than the unemployment rates of January 2001 to January 2005, which ranged from 10.3 to 11.4%.
The underemployment rate for January 2007 also increased slightly to 21.5% from a rate of 21.3% in January 2006. However, the underemployment rate for January 2001 to January 2005 was much lower at a range of 15.9% to 17.5%. This recent surge in underemployment for 2007 may be attributed to the preference of some people to work part-time, for example.
There are no data yet for the visible underemployment rate for the years 2006 and 2007. However, first quarter survey results from 2002 to 2005 showed a stable range of 10.4% to 10.8%. On the other hand, the January 2001 survey showed an unusually high visible underemployment rate of 49.4%.
Data on employed persons are classified into 3 major industry groups, namely: agricultural, industrial and the service industry. As of October 2006, when the latest data on the number of employed persons was released, there were a total of 33.19 million employed people in the country. Out of this number, 12.16 million are employed in Agricultural, 4.9 million in Industrial and 16.13 million in Services. In the Agricultural Industry, the bulk of the employed population fall under the Agriculture, Hunting and Fishery sub-group, which has 10.75 million, employed persons. Under the Industry Group, the greatest number of employed persons is found in Manufacturing at 3.10 million followed by Mining, which has 1.6 million. Under the Services group, the sub-group of Wholesale and Retail Trade, Repair of Motor Vehicles, Motorcycles and Personal and Household goods has the largest number at 6.23 million employed persons; this is followed by Transport, Storage and Communication sub-group which recorded a workforce of 2.47 million; and in third place under the Services Group is the Private Households with Employed Persons sub-group with a workforce of 1.63 million.
INFLATION AND EXCHANGE RATESInflation is defined as the increase in the overall level of prices. For illustration purposes, an inflation rate of 2% means that a basket of different candies, for instance, was worth Php10 the previous year, would have a present market value of Php10.02 due to the inflation rate. Historically, prices of commodities have been steadily increasing while inflation rate varies monthly.
The average inflation this year, from January to April 2007 is 3.37%, which is lower compared to the average inflation rate of year 2006, which is 6.02%. So at least in comparison to last year the momentum of the rise in prices has stalled a bit. (See Appendix D)Exchange rate between two countries becomes relevant when two residents of those countries trade with each other. For instance, the current exchange rate is 45.83 Php/USD, meaning for every 1USD, a Filipino will have to pay 45.83Php, and an American citizen will have to pay 0.021819 USD for 1Php. For the past 12 months, the exchange rate of Php to USD has been decreasing, which characterizes a strong peso. Filipino citizens, can now buy more of local and imported goods that they would buy with the same amount of money/income than they used to 12 months ago, where the exchange rate is relatively higher. (See Appendix E)A case study of inflation differentials and the exchange rates of fifteen countries was conducted (Mankiw, 2003) and it showed a positive relationship between inflation rate and exchange rates. Appendices D and E illustrates the behavior of inflation rate and exchange rates from June 2006 to April 2007. During the times when the inflation rates were high, the Philippine peso was appreciating against the USD.
CONLUSIONWe mentioned earlier that a significant increase in consumer spending might have caused the notable growth in GDP contribution of the Trade Sector as well as the Manufacturing Sector. People have an increased disposable income, in which they use to spend on personal consumption. We think that part of the increase in disposable income may have come from the significant increase in overseas remittances. This, together with the various positive trends in the economic indicators such as an increase in the GDP growth, higher employment rate, decreasing inflation levels, stronger Php-USdollar exchange rate, can trigger a positive trend towards total economic growth. This is of course if no material adjustments will be made to the current quarterÃÂs data and no other factorable elements come into play.
REFERENCESBlanchard, Olivier, 2006, Macroeconomics, 4th Edition, Pearson EducationMankiw, N. G. 2003, Macroeconomics, 5th., pp. 136-137, Worth Publisher, New York.
www.nscb.gov.phwww.pse.org.phwww.wikipedia.com
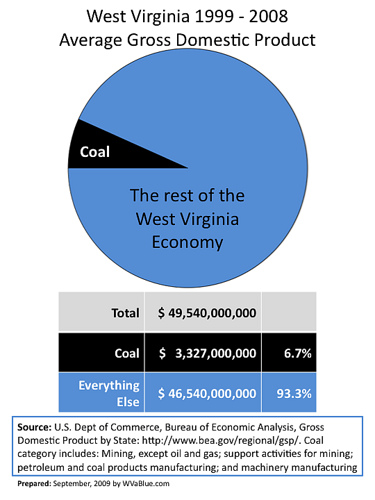 West Virginia 1999-2008 Average Gross Domestic Pro...
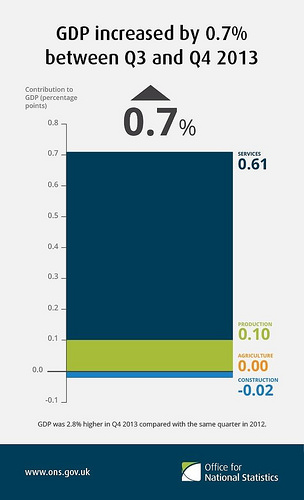 Contribution to #GDP (% points) broken down into s...
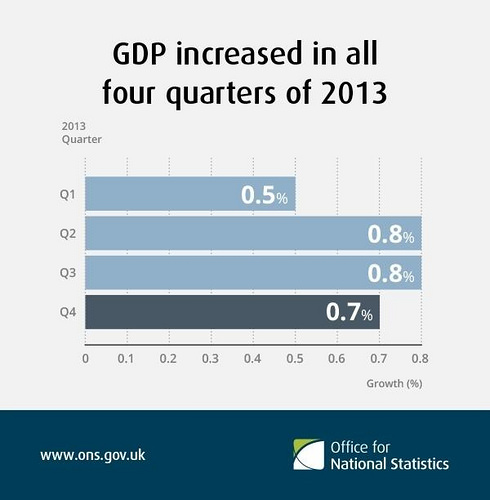 #GDP increased in all four quarters of 2013