Chapter 5 Outline
Objectives
Construct a probability distribution for a random variable.
Find the mean, variance, and expected value for a discrete random variable.
Find the exact probability for X successes in n trials of a binomial experiment.
Objectives (cont'd.)
Find the mean, variance, and standard deviation for the variable of a binomial distribution.
Find probabilities for outcomes of variables using the Poisson, hypergeometric, and multinomial distributions.
Introduction
Many decisions in business, insurance, and other real-life situations are made by assigning probabilities to all possible outcomes pertaining to the situation and then evaluating the results.
Introduction (cont'd.)
This chapter explains the concepts and applications of probability distributions. In addition, special probability distributions, such as the binomial, multinomial, Poisson, and hypergeometric distributions are explained.
Random Variables
A random variable is a variable whose values are determined by chance.
Discrete Probability Distribution
A discrete probability distribution consists of the values a random variable can assume and the corresponding probabilities of the values.
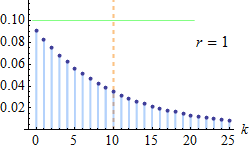 English: Probability mass function of a negative b...
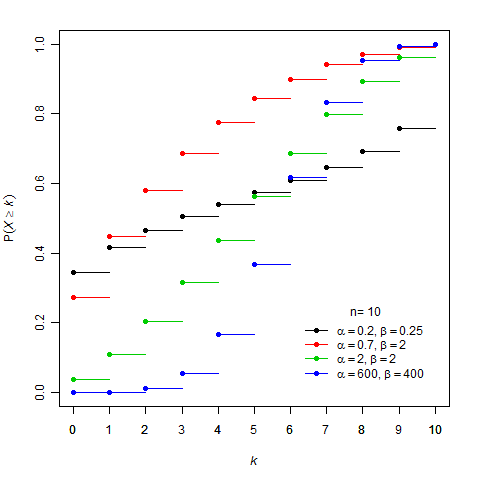 English: Beta-binomial distribution cumulative dis...
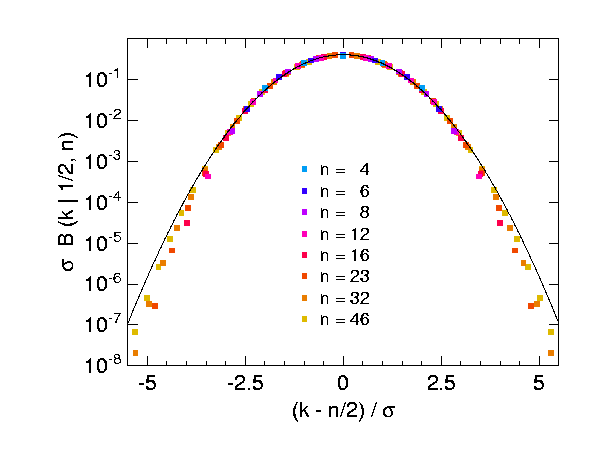 Deutsch: selbst geplottet
The probabilities are determined theoretically or by observation.
Calculating the Mean
In order to find the mean for a probability distribution, one must multiply each possible outcome by its corresponding probability and find the sum of the products.
Rounding Rule
The mean, variance, and standard deviation should be rounded to one more decimal place than the outcome, X.
Variance of a Probability Distribution
The variance of a probability distribution is found by multiplying the square of each outcome by its corresponding probability, summing those products, and subtracting the square of the mean.
The formula for calculating the variance is:
The formula for the standard deviation is:
Expected Value
Expected value or expectation is used in various types of games of chance, in insurance, and in other areas, such as decision theory.
Expected Value (cont'd.)
The expected value of a discrete...