�PAGE � �PAGE �11�
S.M.A.R.T. Goals and Key Performance Indicators
Business Report
for
nTelos Wireless Pavilion
Submitted to:
Professor Philip Arlen
By:
Heather Fritz
Full Sail University�
Table of Contents
TABLE OF CONTENTS â¦â¦â¦â¦â¦â¦â¦â¦â¦â¦â¦â¦â¦â¦â¦â¦â¦â¦â¦â¦â¦ 2
TABLE OF FIGURES â¦â¦â¦â¦â¦â¦â¦â¦â¦â¦â¦â¦â¦â¦â¦â¦â¦â¦â¦â¦â¦â¦ 2
EXECUTIVE SUMMARY â¦â¦â¦â¦â¦â¦â¦â¦â¦â¦â¦â¦â¦â¦â¦â¦â¦â¦â¦â¦ 3
INTRODUCTION â¦â¦â¦â¦â¦â¦â¦â¦â¦â¦â¦â¦â¦â¦â¦â¦â¦â¦â¦â¦â¦â¦â¦. 4
Background â¦â¦â¦â¦â¦â¦â¦â¦â¦â¦â¦â¦â¦â¦â¦â¦â¦â¦â¦â¦â¦â¦â¦ 4
DEFINITIONS â¦â¦â¦â¦â¦â¦â¦â¦â¦â¦â¦â¦â¦â¦â¦â¦â¦â¦â¦â¦â¦â¦â¦â¦.. 5
S.M.A.R.T. GOAL RECOMMENDATIONS â¦â¦â¦â¦â¦â¦â¦â¦â¦â¦â¦â¦.. 6
Recommendation 1 â¦â¦â¦â¦â¦â¦â¦â¦â¦â¦â¦â¦â¦â¦â¦â¦â¦â¦â¦.... 6
Recommendation 2 â¦â¦â¦â¦â¦â¦â¦â¦â¦â¦â¦â¦â¦â¦â¦â¦â¦â¦â¦â¦ 7
Recommendation 3 â¦â¦â¦â¦â¦â¦â¦â¦â¦â¦â¦â¦â¦â¦â¦â¦â¦â¦â¦â¦ 8
Recommendation 4 â¦â¦â¦â¦â¦â¦â¦â¦â¦â¦â¦â¦â¦â¦â¦â¦â¦â¦â¦â¦ 9
CONCLUSION â¦â¦â¦â¦â¦â¦â¦â¦â¦â¦â¦â¦â¦â¦â¦â¦â¦â¦â¦â¦â¦â¦â¦â¦. 10
REFERENCES â¦â¦â¦â¦â¦â¦â¦â¦â¦â¦â¦â¦â¦â¦â¦â¦â¦â¦â¦â¦â¦â¦â¦â¦.. 11
Table of Figures
Figure 1: nTelos Wireless Pavilion dedicated e-commerce page on Ticketmaster.com
Figure 2: Data from Event Pages - Behavior Analytics Report.
Figure 3: Data from Newsletter Sign Up page on Pavilion website.
Figure 4: Excel Based Social Media Scorecard.
Figure 5: Audience Overview
Figure 6: Traffic
�
EXECUTIVE SUMMARY
As nTelos Wireless Pavilion begins the task of designing a new website for the 2015 concert season, it is critical that we set specific and measurable goals in order to attain success.
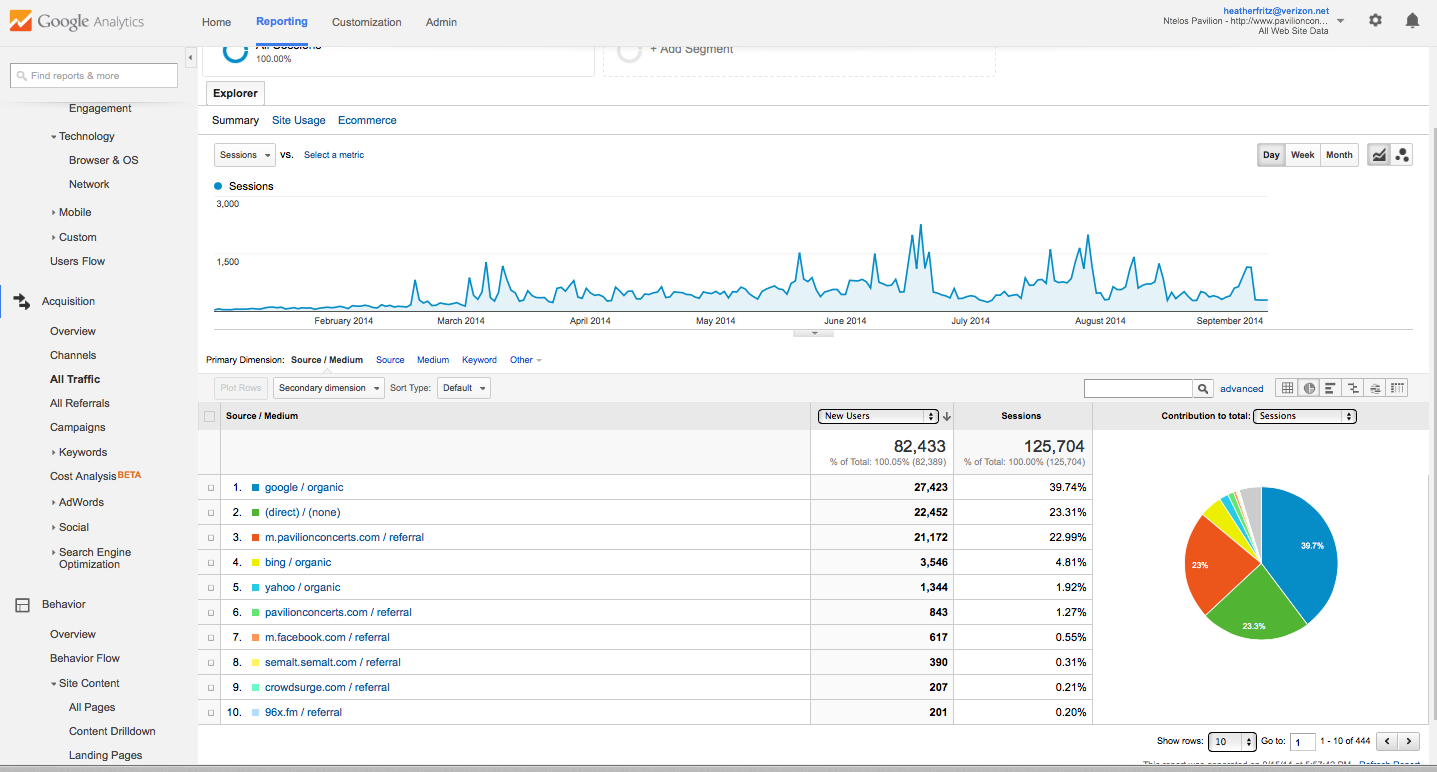 Figure 6
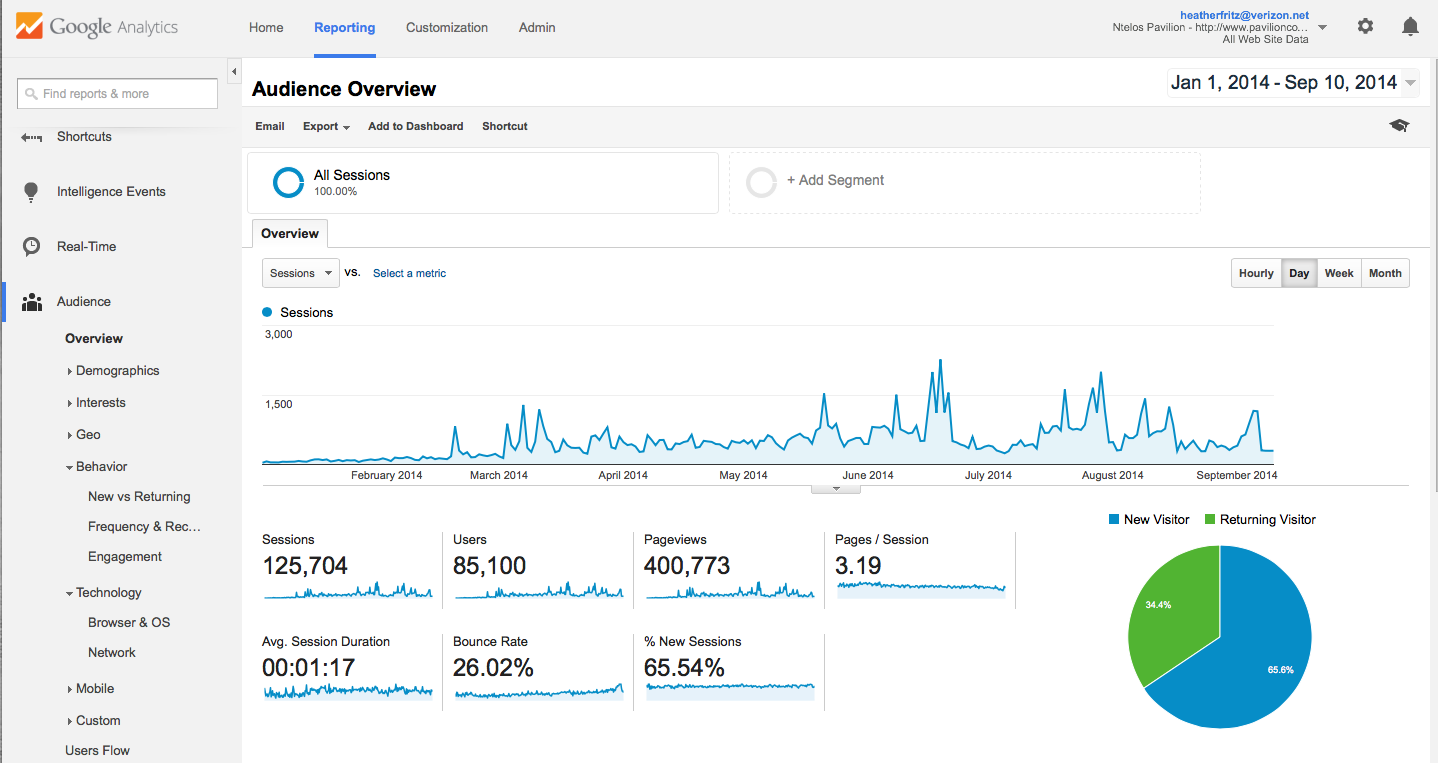 Figure 5
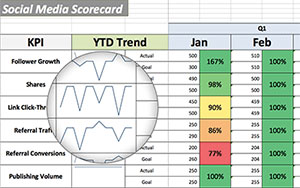 Figure 4
Using web metrics, we can measure the progress towards these goals to determine the return on investment. It is important to set specific, actionable goals that contain a clear unit of measurement. By using S.M.A.R.T. goals and KPI's, nTelos Wireless Pavilion will be able to track progress and ROI more efficiently and accurately.
This report will address the definitions of S.M.A.R.T. goals, KPI's and key analytic terms and phrases. The research will then reveal five specific recommendations for goals that will target to improve the different aspects of the nTelos Wireless Pavilion website by examining various relevant web analytics. Final recommendations accompanied with key performance indicators that will measure the performance of each of nTelos Wireless Pavilion's S.M.A.R.T. goals.
Recommendations laid out in this report:
Goal: Increase online ticket sales revenue.
KPI's: Unique Visitors, Bounce Rate
Goal: Increase e-newsletter subscribers
KPI's: Conversion Rate, Traffic sources
Goal: Increase number of visitors who complete a specific navigational path
KPI's: Engagement Rate, Social Network Presence
Goal: Increase number of new visitors to the website.
KPI's: New vs returning visitors, Unique Visitors
�
Introduction
nTelos Wireless Pavilion is a 6500 capacity outdoor concert facility located in Portsmouth, Virginia. During the "off season" nTelos Wireless Pavilion will begin the process of redesigning the website to serve as a successful revenue generator. The best way for this to be accomplished is to set clear and attainable goals with precise methods of measurement. The following report will address the strategies that nTelos Wireless Pavilion must implement by using S.M.A.R.T. goals and KPI's in order to successfully optimize their website for revenue generation.
Background
nTelos Wireless Pavilion is owned by the City of Portsmouth, Virginia and operated by Integrated Management Group. The Pavilion opened its doors in 2001 and had seen several changes in management until 2006 when Integrated Management Group was awarded the contract. Currently the venue sells its tickets through the national ticketing company Ticketmaster. Each online transaction is facilitated through the Ticketmaster.com website. nTelos Wireless Pavilion has a dedicated venue page on the Ticketmaster.com website.
http://www.ticketmaster.com/nTelos-Wireless-Pavilion-tickets-Portsmouth/venue/8725
Figure 1: nTelos Wireless Pavilion dedicated e-commerce page on Ticketmaster.com
Definitions
S.M.A.R.T. Goals
A S.M.A.R.T. goal is a way of defining a goal very specifically so that it is easier to accomplish. S.M.A.R.T. goal is defined as one that is Specific, Measurable, Actionable, Relevant and Timely.
Specific: The goal answers what, when and why.
Measurable: The goal answers how much, how many, or how will I know when it is accomplished.
Actionable: The goal identifies the requirements to make it happen and constraints that may keep you from attaining the goal.
Relevant: The goal should be relevant to the overall business mission and industry.
Timely: The goal has a start and an end date.
KPI's
A KPI or Key Performance Indicator is a metric that helps a business measure its progress toward a goal, or in this case a S.M.A.R.T. goal.
Key Metric Terms
Conversion Rate: The percentage of visitors that complete a certain task
Unique Visitors: The number of visitors who have not previously viewed the site (may be off in accuracy due to visitors who do not allow cookies).
Bounce Rate: The percentage of visitors who only view one page on your site.
Navigation Path: The path a website visitor takes to a certain page or conversion.
�
S.M.A.R.T. Goal Recommendations
Recommendation 1: Increase online ticket sales revenue.
Encourage the online user to purchase concert tickets online to an upcoming event, thus increasing online sales by 5% over the next month.
KPI: Increase in the percentage of unique visits to the Pavilion website.
Social media links that give reason to connect, such as pre-sale passwords, special offers and more.
PPC ads that link back to the website.
KPI: Decrease bounce rate.
Design information around priorities. Make sure users immediately get a sense of what they should expect to find or are expected to do while on the page.
Optimize for intent. Based on keywords your visitors are using to get to your page, you should be serving them an experience that addresses their expectations.
Figure 2: Data from Event Pages - Behavior Analytics Report.
The above Figure shows the bounce rates for the individual event pages. The percentage of users that visit the individual events pages and spend time during that session is lower than average and should be monitored to maintain that low percentage.
Recommendation 2: Increase e-newsletter sign-up.
Encourage user to sign up for e-newsletter, thus increasing brand awareness by 30% over the next six months.
KPI: Increase subscription conversion rate.
Count number of sign-ups or forms filled out.
Easy to find SIGN UP links on site.
Bullet points that give the user a summary of key benefits to signing up for newsletter options.
Figure 3: Data from Newsletter Sign Up page on Pavilion website.
The above figure shows that 520 visitors viewed the Newsletter Sign Up page on the Pavilion website. If a report were to be set up to measure the number of visitors who filled out the newsletter sign up form on the page, then a conversion rate would be measured.
KPI: Traffic Sources.
Measure which traffic sources are driving visitors to your website to sign up for the email newsletter. The main sources of website traffic are direct, referral, search and paid search.
Recommendation 3: Increase number of visitors who complete a specific navigational path towards social media inclusion.
Encourage visitor to click on social media icons in an effort to convert user to social media followers, thus increasing brand awareness by 30% over the next six months.
KPI: Engagement Rate. Measuring the amount of user interactions (Likes, Comments and Shares) that occur with pages.
Increase fan engagements rates for published content.
Increase share ratio and number of comments.
KPI: Social networking presence.
Increase Likes, shares and comments on social pages.
Figure 4: Excel Based Social Media Scorecard
The above graphic illustrates a scorecard template that automatically calculates trend lines and color-codes scores and should be used for weekly monitoring. Growing the number of followers means growing the brand's reach on social networks. Growth in the sharing of the nTelos Wireless Pavilion brand content is a valuable engagement metric and is important to audience growth.
Recommendation 4: Increase number of new visitors to the website.
Increasing the number of unique visitors to the nTelos Wireless Pavilion website over then next 30 days by 10% will raise the probability of gaining new customers.
KPI: New vs Returning Visitors rate.
Unique Visitor rate
Figure 5: Audience Overview
This metric provides insights about the loyalty of your audience and shows you how many new visitors you attract on your website.
KPI: Number of unique visitors to your site from directional navigation.
Traffic from bookmarks and email links that do not have tracking codes etc.
Traffic from referral links across the web or in trackable email, promotion and branding campaigns.
Traffic from search queries from any major or minor web search engine.
Traffic from specific search engine terms and phrases.
Traffic from social networking sites.
�
Figure 6: Traffic
CONCLUSION:
Setting goals for any KPI requires a well thought out plan. Use past performance as future indicators, but also be sure to shoot for growth. Be conservative and start slow. Growth takes time, but with diligence it can be done. KPI's can be developed through a few simple steps. Just generate metrics in relation to your critical success factors, assign corresponding values, and determine the method of frequency with which those metrics should be reported for nTelos Wireless Pavilion to reach its major goal of increasing revenue.
References