IntroductionTextile manufacturing is one of the oldest of manÃÂs industries and has appeared as one of the results of the Industrial Revolution. In the 19th century it became a mainstream industry with a huge production of clothing. In the 20th century, in order to protect existing industries (which are being threatened by the developing countries) the developed world started to employ immigrants from developing countries in textile manufacturing being paid less than minimum wages. (1)Nowadays textile industry has less and less significance in the developed world due to the trade with mainly Asia, Indonesia and Latin-America. It means that the developing countries represent much more workers in the manufacturing of textiles in opposed to the developed ones. (2)In this project IÃÂm going to compare two developed European counties concerning the development in personal hourly wages of their workers in textile-manufacturing. All incomes are converted into ppp dollars. (see appendix 1.)
 Clothing and Textiles
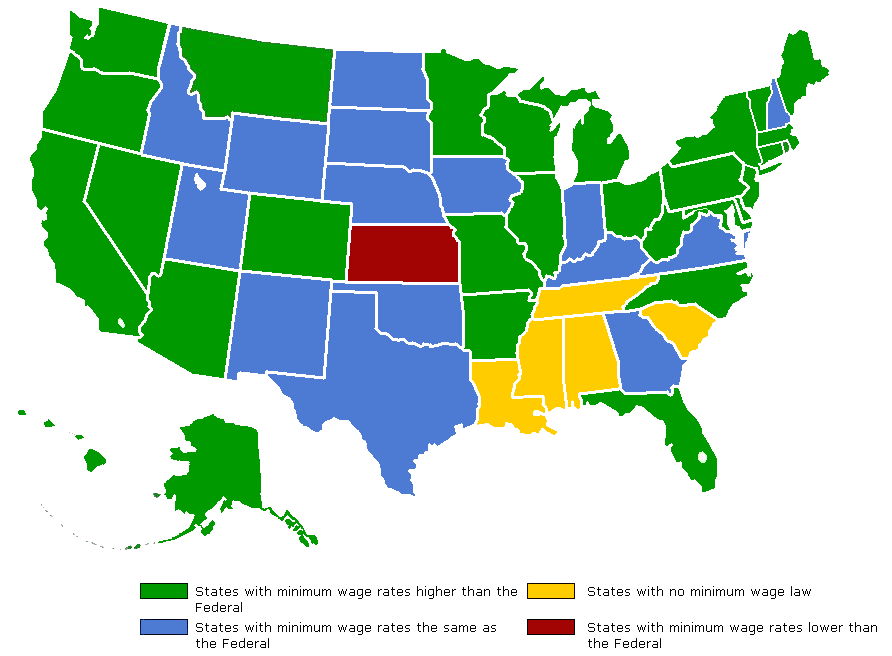 Minimum wages nationwide.
 Map of minimum wage rates in the United States. Se...
The two countries are Denmark and the United Kingdom. I have chosen the textile industry because it has such an old and important history, it can even be said that it is the mother of all industries. As for the other county, originally I was going to compare Denmark with a developing country because I would have found the process and probably also the outcome very interesting. However due to the lack of data I had to choose another developed country, therefore I chose the United Kingdom as textile industry is hugely associated with it due to the Industrial Revolution.
It also has to be mentioned that the data was not available for the same 20 years for both of the counties, which resulted in the analysis of the period 1984-2003, where the data for 1993-94 in Denmark was not available either. Another thing to mention is that the Danish data from 1984-1992 refers to wage earners while from 1993-2003 it is stated as employees. As there is a significant difference between the two, I have chosen the same kind of data for the United Kingdom to be able to compare the two counties. Therefore, from 1984 to 1992 I am analysing the income of wage earners in both countries and from 1995 to 2004 I am comparing the income of employees in both countries. (see data in appendix 2.)Research questionDo personal hourly incomes in textile-manufacturing differ between genders in the UK and in Denmark? If yes, why?Theoretical backgroundAs it was mentioned in the introduction textile industry has lost its significance in the developed word during the last century, which is caused by the growing trade with the developing countries. During the period between 1970 and 1990 there was a huge downfall of textile industries in Western Europe.
ÃÂIn Denmark the textile and clothing industry collapsed with 87% decline in real GVA between 1970 and 1994ÃÂ (3).The physical production has been moved out of Denmark due to the trade. Many of the raw materials are no longer shipped from Denmark. As a result the Danish textile industry had a significant change, which created a more high value adding industry and became less labour intensive. In the period between 1993 and 2004 the input decreased in the employment of textile manufacturing with 50%. However, the value of production has only decreased slightly and gross value added tax in the textile business has almost remained stable in fixed prices despite the fact that employment has been significantly reduced (Cornett, 2005). (3)The same changes can be seen in the British textile industry in this period. After the industrial revolution BritainÃÂs main export earner was its textile industry. It only depended on BritainÃÂs capacity to build the advanced machinery. Between 1979 and1991 a huge decline can be seen in the employment of manufacturing in the United Kingdom. The sharpest decline actually occurred in textile-manufacturing, where competition from low-wage economies has been particularly intense for established industrial countries (Greenaway, Hine, Wright, 1998). (4)Analysischart 1.
Firstly it has to be stated that the personal income rates from textile manufacturing in Denmark are generally higher than in the UK. It is clear that during this 20 year period the development of incomes was much higher than in the UK. In order to analyse the difference we need to have a brief look of the economical background of these two countries:In Denmark wages are set at the level where supply and demand equal for a specific type of worker. In theory everyone ends up with getting a wage equal to the value of the marginal output. In reality, however, many things influence individual wages. Unions play an essential role on the labour market: they are compressing the wage scales so the difference between low paid and high paid is limited. The most recent wage system is the minimum pay system, where the only agreement between unions and employers is that nobody can get a salary under a given level.
In the UK the National Minimum Wage was introduced in 1999. The initial level was set at ã3.60 an hour (ppp$ 5.59) for those aged 22 and over, with a lower level, ã3.00 an hour (ppp$ 4.66), being set for those aged 18 to 21. Between 1992 and 1997 the hourly earnings of employees at the bottom of the hourly earnings distribution grew more slowly than the median. The hourly earnings of those at the top of the distribution grew fastest. By 2003 the adult minimum wage had increased by 25 per cent. The hourly earnings of the lowest paid grew faster than the median between 1998 and 2003. Those at the upper end of the hourly earnings distribution continued to have higher wage increases than the median. Similar findings are observed for all employees, male and female, full-time and part-time. (8)Between 1992 and 1997 the median gross hourly wage, for adults aged 22 and over, grew by 17.0 per cent compared with an increase in the mean of 19.2 per cent. Throughout both periods, wage increases were generally greater than price increases along the hourly earnings distribution. The introduction of the National Minimum Wage, if it was to have an impact, would increase the hourly wages of the lowest paid relative to other employees. (8)Men, on average, receive higher hourly earnings than women. Between 1992 and 1997 median hourly earnings for men grew by 16.9 per cent compared with 20.3 per cent between 1998 and 2003. The pattern for women is similar, in that there are noticeable increases in hourly earnings for those at the bottom of the earnings distribution following the introduction of the minimum wage. The Low Pay Commission Report (2005) showed that women were more likely to be low paid. The median hourly wage for women grew by 19.1 per cent between 1992 and 1997 compared with 25.7 per cent between 1998 and 2003 (a faster rate of growth than for men in both periods). (8)Since the introduction of the minimum wage, the hourly wages of the lowest paid workers have increased by more than the increase for the median worker. This is in contrast to the period before the introduction of the minimum wage when the hourly wages of the lowest paid increased by much less than those of the median worker. It should be noted that in both periods there were substantial increases in the hourly wages of the highest paid workers. (8)In conclusion, the increase in median hourly earnings for adults aged 22 and over was greater than the increase in hourly earnings for those in the bottom half of the hourly earnings distribution in the period 1992 to 1997. This contrasts with the period that covers the introduction of the minimum wage. Between 1998 and 2003 hourly earnings at the lower end of the pay distribution grew faster than at the median. (8)Secondly I am going to analyse the development of personal incomes from textile-manufacturing by comparing the two countries. We can see that the development of the incomes is more intense in Denmark especially from 1995. In order to see the reason of the difference we have to have a closer look at the taxation system of each country.
Tax rates in Denmark are among the highest in the world. People pay tax depending on the hours they work. Income taxes are calculated as income minus deduction multiplied by the relevant tax rate. The Danish tax system is progressive since the overall tax rates rise with income. Personal income comprises wages, social security benefits, etc. In personal income there is a deduction of payments into pension funds and of labour market contributions.
Denmark's main indirect tax is the value-added tax (VAT). The current standard rate is 25%.
During this 2 year period there have been 3 tax reforms in Denmark (1987, 1994, and 1998) that reduced marginal tax rates, although the 1998 tax reform increased the marginal rate for high income groups. A large proportion of tax payers are now paying about 63% in tax at the margin. However, low-income earners may also have a very high tax rate because when their income goes up they pay more tax and also lose part of their social benefits. We can see on the charts that the tax reforms (especially the ones in 1994 and 1998) have caused an income rise in Denmark.
The only way to value the overall tax burden resting on labour is to consider the tax wedge giving the difference between the cost of labour for employers and the real purchasing power of wages for employees. Thus the wedge includes not only personal income taxes and social security contributions but also indirect taxes. The average wedge for the EU was 51.8% in 1997. Denmark has the 2nd highest wedge with 60.1% and the UK has the lowest wedge of the EU countries with 39%. (Andersen and others, 2002).
Income tax forms the bulk of revenues collected by the government.Income tax is lower in the UK than in many countries. (6) In fact it is the lowest in the EU in opposed to Denmark which has the 2nd highest tax-rate. This fact can explain why the general income rate is lower in the UK than in Denmark.
The main indirect tax in the UK is the value-added tax (VAT) like in Denmark. Public social expenditure is spending by the government on benefits to, and financial contributions targeted at, households or individuals, to support them during periods when their circumstances adversely affect their welfare, for example: pensions, maternity payments, childcare and tax breaks. (6)chart 2.
chart 3.
chart 4.
chart 5.
In order to compare the income rates in textile manufacturing between men and women in each country separately we have to look at some historical facts. As it has been mentioned textile industry is one of the oldest manufacturing industries and gained its significance in Europe after the industrial revolution. In Britain it was the leading manufacturing industry. It was that time when women needed to start working as well as men in order to be able to survive. Therefore women started to work at textile firms but they didnÃÂt get high wages because women were not considered to work those times. So they had to do with what they got. Their wages in fact were even half of menÃÂs incomes. During the history this perception has obviously changed, now women have the same hourly wages as men in textile factories. It appears that the gap between men's and women's incomes has closed considerably since the equal rights movement of the 1960s. Why does the graph still show that women working in textile-manufacturing earn less hourly wages than men?ÃÂWithin the EU women made up 77 % of low income employees in 1995 and earned on average 25 % less than men. The UK fell somewhere in the middle with a pay gap of around 22 %.No single cause has been given to explain why a pay gap persists. Reasons offered range from a reflection of women's less advantageous position in the labour market itself, to age, education, the type of work, taking a career break and lack of promotion opportunities.ÃÂ (7)The Bureau of Labor Statistics notes that only 5.1 % of all women in the workforce take more than a week off for any reason (including maternity leave) beyond regular vacation time. This is not significantly more than the 3.3 % of men who do the same. (7)The 1998 Employment in Europe report found that age was only part of the reason. The gap exists in all age groups but widens significantly the older the worker. For women aged 40 to 54 working full time, average hourly earnings were over 20 % lower than men's in all EU countries. In the UK they were 40 % lower. The same study found that length of service made little difference within age groups.
ÃÂCurrent research found that, to an extent, the pay gap is a result of differences in the kinds of jobs performed by men and women. ÃÂGender segregationÃÂ of the labour market led to an unequal distribution of women and men in different sectors, branches of industry and occupations, which had a direct bearing on the pay gap. While the concentration of women in some occupations has provided women with protection in recent years against job losses, and has sheltered them from competition from unemployed men, it has also resulted in an above average wage penalty. This means that women who work within occupational groups with a large majority of women are penalised compared with other groups, and they earn less in relation to the average earnings of all women.ÃÂ (8)It would appear that women experience more difficulty than men in advancing their pay no matter what type of job they do.
In Denmark it can also be stated that there are wage differentials between men and women. The median is higher for men than women as well as in the UK and in every country of the EU. However, it can also be stated that the difference in incomes of textile-manufacturing between genders is smaller than in the UK. The development of income seems to be the same for men and women while in the UK the income for men tend to develop with a higher intensity than for women. (Andersen and others, 2002)ConclusionIt can be said that that personal incomes in textile-manufacturing differ between men and women in both Denmark and the United Kingdom. We have seen that this difference is larger in the UK. After analysing the development of the total income rates in both of countries separately it can be stated that the development in Denmark has a much higher intense than in the UK. It is firstly because of the tax-differences; the tax-rates in Denmark are much higher than in the UK, which causes a rise in the incomes. Secondly Denmark had 3 tax-reforms during the examined period that also caused sudden income rises.
In the next stage we went on to analyse the personal income rates in textile-manufacturing between men and women. Firstly it is seen that in Denmark wages of women are closer to wages of men in textile-manufacturing than in the UK. Then we had a closer look at each country concerning their income differences between genders. The analysis shows that in Denmark the income development of men and women have the same intense, while in the UK menÃÂs wages had a higher development rate. Many possible reasons were taken into consideration to find out why womenÃÂs incomes are still lower than menÃÂs: working hours, age, maternity leave, vacation. However, these facts only differ slightly from men.
All in all, what I have learnt from this research is that textile industry is not a major industry in Europe any more. Therefore it doesnÃÂt have a great importance in Danish and British economy. However we can state that personal incomes are developing in textile-manufacturing in spite of the declining employment. MenÃÂs and womenÃÂs hourly income still defers within this industry in both Denmark and the UK: men seem to earn higher wages. In the UK menÃÂs hourly income even has a higher development than womenÃÂs. However, the question why men have higher incomes than women in textile-manufacturing cannot be answered. In history women always earned less than man. Even though hourly income rates are getting more and more equal it will still take some time while womenÃÂs income reaches menÃÂs.
References1. http://en.wikipedia.org/wiki/Textile_industry2. http://en.wikipedia.org/wiki/Textile_manufacturing3. http://www.ersa.org/ersaconfs/ersa05/papers/117.pdf(Andreas P. Cornett: economic integration in a cross border perspective: An emerging new system of production (2005).)4. http://www.nottingham.ac.uk/economics/leverhulme/research_papers/98_3.pdf(D. Greenaway, R. C. Hine, P. Wright: An Empirical Assessment of the Impact of Trade on Employment in the United Kingdom (1998).)6. http://www.workgateways.com/working-uk-taxation-how-much.html7. http://www.findarticles.com/p/articles/mi_m0FXS/is_4_80/ai_735536528. http://www.findarticles.com/p/articles/mi_qa3999/is_200510/ai_n15846815(Low Pay Commission, National Minimum Wage, Low Pay Commission Report 2005, Cm 6475, The Stationery Office (2005).)
 Faith, Fraud & Minimum Wage
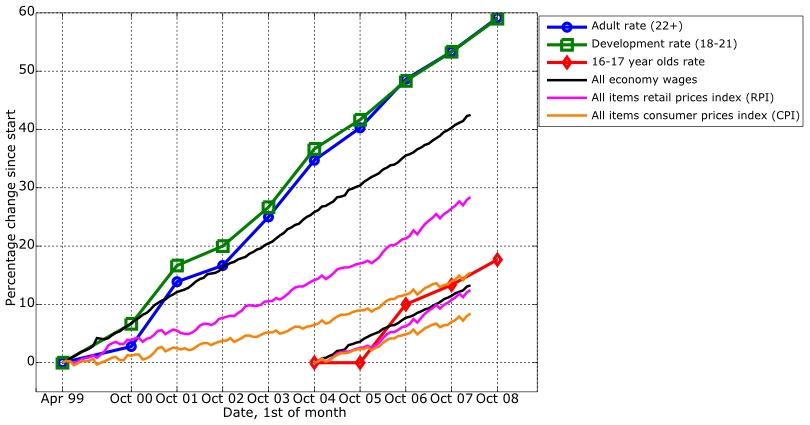 UK National Minimum Wage changes