Maths Coursework:
Aim:
The aim of my investigation in this maths coursework is to investigate the used car sales. I will need to investigate on these variables:
-The price of the cars
-The age of the cars
-The makes of the cars
-The cost when new of the cars
-The mileage of the cars
-The engine sizes of the cars
All the variables above are ratio variables (Numbers are used) except the makes of the cars, because that one is special and it's called nominal variables.
I will first try to find out any links between the current price of the car and the other variables such as age, mileage, car engine size, and the make. After finding links, I will then attempt to progress the data in order to find out stronger links between variables and eventually I will try to find a general value or formula that can link them.
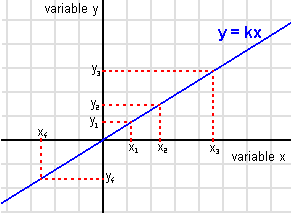 Variables proporcionals
 Priced Out Of Lingerie, Milan
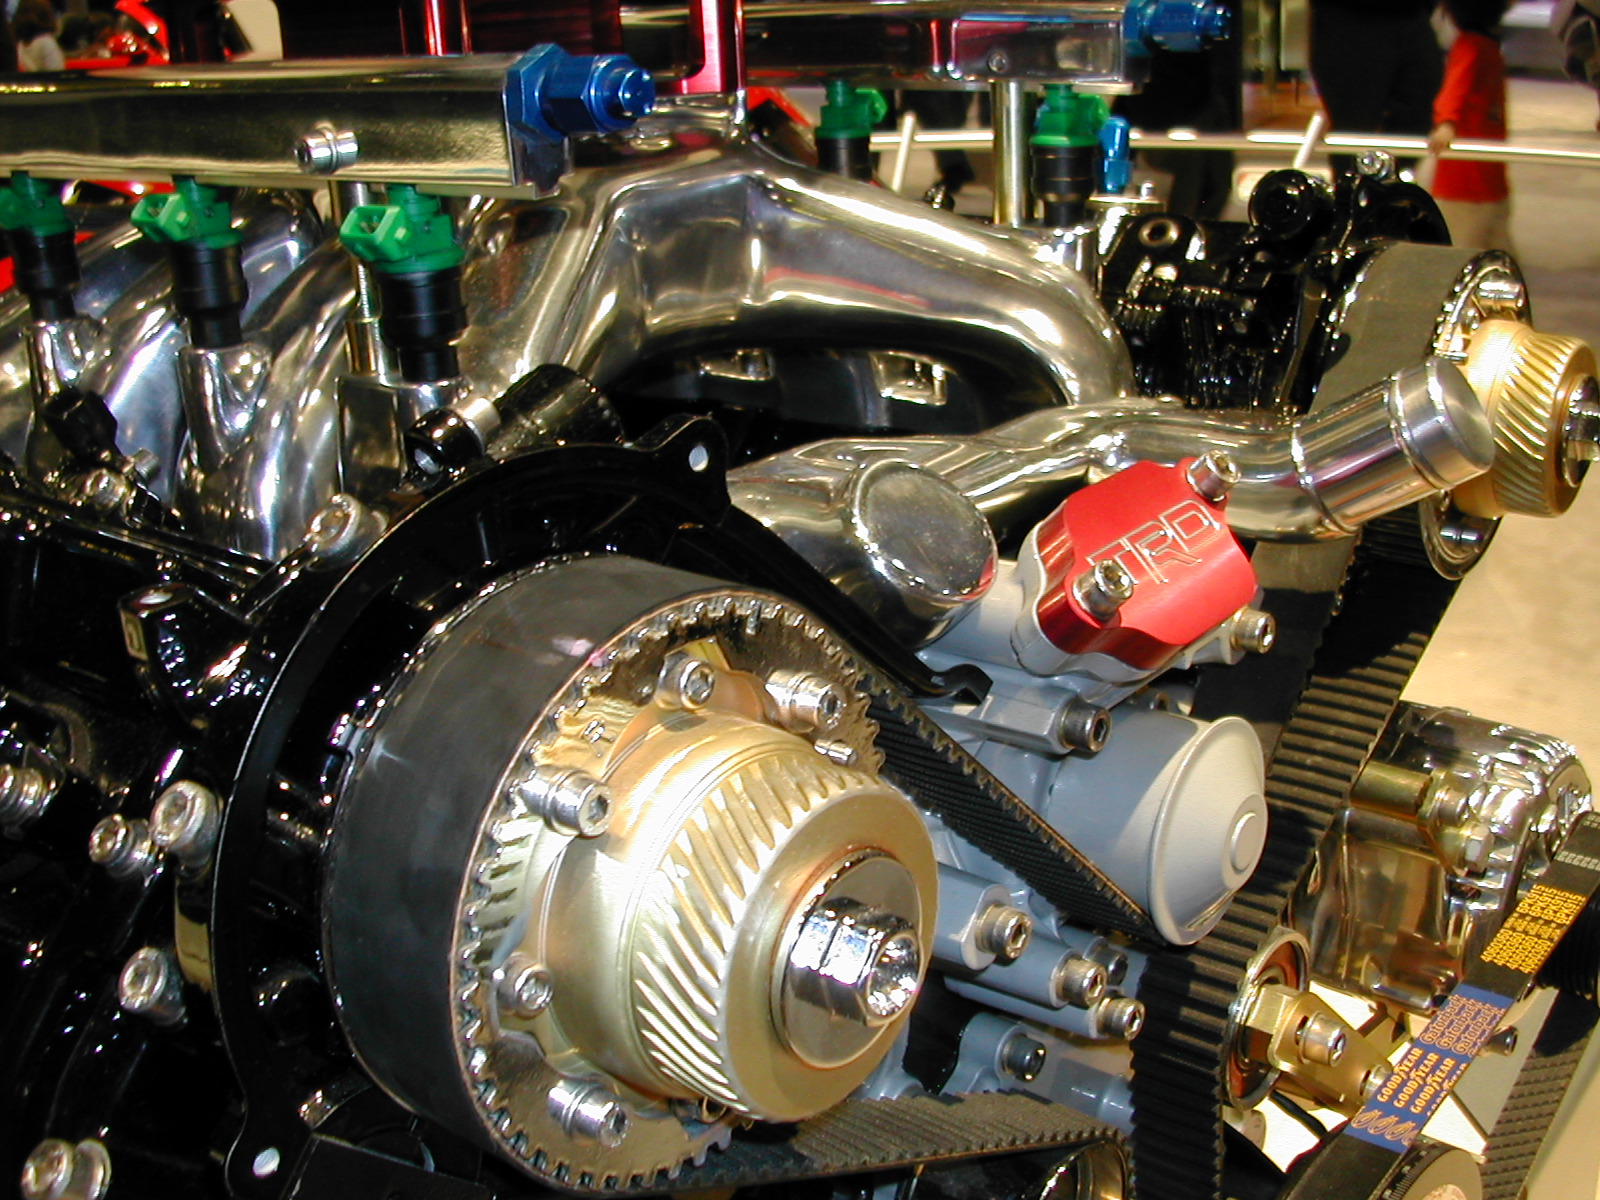 An automobile engine partly opened and colored to ...
I will be drawing some graphs and then look for conclusions, which can help me to find a general formula.
Hypothesis:
I predict that all of the variables will affect the Price of the cars in anyway, because they all are very important. So I think the Age will affect the price most, because it is the most important variable of all and I think the Engine Size affects the least, however all the variables will affect it in some ways.
Graphs:
1. First of all, I will be comparing the prices of all thirty-six cars with their age and the mileage. I believe in terms of the general knowledge as the age/mileage of the car increase, the price of the cars should become cheaper. For example, if a car has been driven a lot, it would surely have depreciated as it has been used a lot.