Introduction
This report is going to outline and explain pricing issues in the Australian wheat industry, covering the topics of production & consumption, trade, industry structure and price. Australia is currently one of top five wheat producing countries in the world. We represent only 3% of global wheat production but account for up to 18% of total world exports.
Production
Between 1995 & 2000 wheat production in Australia averaged 37.2million tonnes with Western Australia being the biggest producer with an average annual production of 13.19million for the same period. There is about 32,000 grain growing farm in Australia out of about 70,000 board acre farms. On average grain industry farms are about 307ha and producing around 620t. Production declined to 10.05million tonnes in 2002-2003 due to the drought. Australia normally exports about 16.5million tonnes or 16% of the world trade which was also affected by the drought in 2002-2003 with only10.8m/t
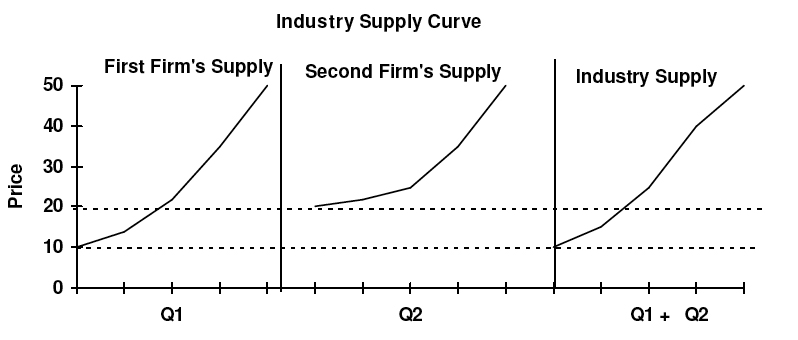 English: pc inductry supply curve
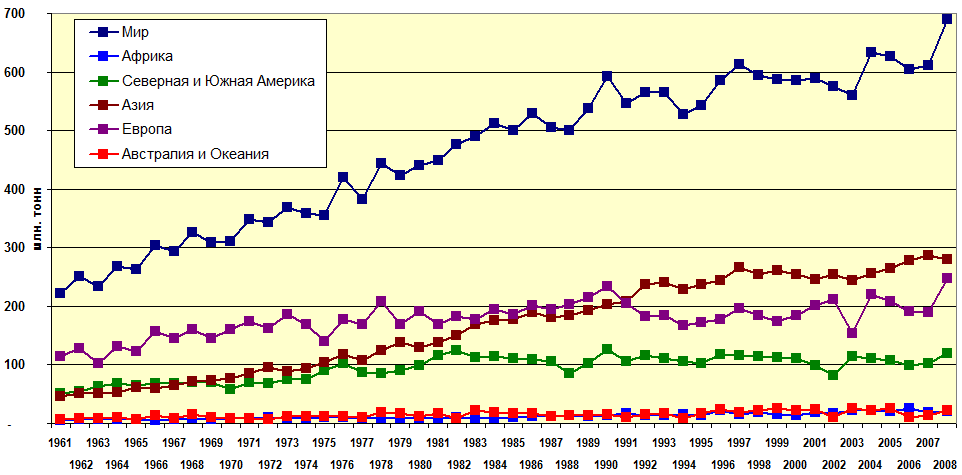 English: World wheat production (mln tonnes)
 Government House, Perth, Western Australia.
being exported in that period. Once the drought had subsided in 2003 Australian production has risen to 25 million tonnes in the 2003-2004 season which tops the record production achieved in 99/00 of 24.8 million tonnes.
Graph 1: Australian Wheat Production 1981 - 2001
Price
Early in 1996 wheat prices were historically high at up to 750USâ/Bu due to a world grain shortage and concerns about the American winter crop. This affected both feed and food grains which peaked in May to June.
Chart 1: Wheat Prices 1995 - 2005 USâ/Bu
Date Opening Price High Price Low Price Closing Price
Mar-95 352.5 357 345.5 357
Mar-96 507 750 506.5 640
Mar-97 378.5 379 377 378
Mar-98 321 322 320 320
Mar-99 268 272 267 272
Mar-00 256 259.5 256 259.5
Mar-01 278.5 278.5 275.25 276.75
Mar-02 270 272 270 272
Mar-03 312 315 310 311
Mar-04 354 359 354...
Works Cited
I thought this was a well thought out essay, and I especially liked that the works cited were well in order and easy to find and understand.
1 out of 1 people found this comment useful.