ANALYSIS OF PRINCIPLES OF WORKING CAPITAL
SIZE OF THE WORKING CAPITAL
Size of working capital=Current assets/ Total assets X 100
Size of the working capital of ITC-PSPD Ltd during the year
2010-2013
Year | Current Assets | Total Assets | Size of the Working Capital |
2010 | 656.74 | 2602.54 | 25.23 |
2011 | 820.49 | 2987.09 | 27.47 |
2012 | 960.38 | 3397.39 | 28.27 |
2013 | 1034.5 | 3821.6 | 27.07 |
TOTAL | 3472.11 | 12808.62 | 108.04 |
AVERAGE | 868.0275 | 3202.155 | 27.01 |
Interpretation:
From the above table we find the size of the working capital period is increased in the year 2010 to 2012 there should be gradual to increased or decreased in the ratio of increased in the year 2010 to 2012 and decreased in the year 2013. On overall low ratio indicates high profits.
Size of Working Capital of ITC-PSPD
STRUCTURE OF THE CURRENT ASSETS
Structure of the current assets in working capital of ITC-PSPD Ltd during the year 2010-2013
Particulars | 2010 | 2011 | 2012 | 2013 | Average |
a) Inventories | 401.64 | 525.06 | 607.34 | 719.4 | 563.36 |
b) Sundry Debtors | 146.57 | 159.13 | 201.36 | 213.19 | 180.0625 |
c) Cash & Bank Balances | 1.73 | 0.56 | 2.69 | 7.13 | 3.0275 |
d) Interest Accrued on Loans & Deposits | 0.15 | 0.09 | 0.09 | 0.08 | 0.1025 |
e) Deposits | 8.92 | 8 | 10.46 | 11.95 | 9.8325 |
f) Loans & Advances | 97.74 | 127.66 | 138.44 | 82.75 | 111.6475 |
Total | 656.75 | 820.5 | 960.38 | 1034.5 | 868.0325 |
Interpretation:
From the above table we find the structure of the Total Current Assets in working capital is increased during the years 2010 to 2013.
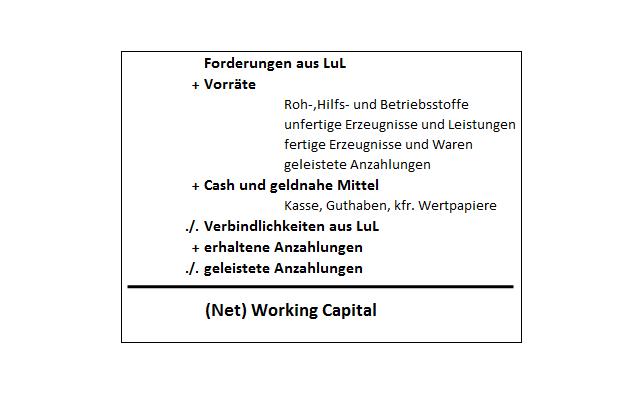 English: Berechnung des Net Working Capital
 English: Cathedral of St. John the Divine — A st...
 English: Southern liveried Class 319/2 No. 319219 ...
The average value is 868.03 which is higher than the values of Current Assets during the years 2010 and 2011.
Structure of the Average of current assets in working capital of ITC-PSPD Ltd
STRUCTURE OF THE CURRENT LIABILITIES
Structure of the current liabilities of ITC-PSPD Ltd during the year 2010-2013
Particulars | 2010 | 2011 | 2012 | 2013 | Average |
a) Hundies & Acceptances | 1.19 | 0.93 | 2.07 | 2.16 | 1.59 |
b) Sundry Deposits | 12.7 | 15.33 | 18.25 | 19.4 | 16.42 |
c) Sundry Creditors | 243.21 | 165.17 | 167.04 | 202.52 | 194.49 |
d) Provisions | 41.27 | 117.94 | 130.9 | 142.7 | 108.20 |
Total | 298.37 | 299.37 | 318.26 | 366.78 | 320.70 |
Interpretation:
From the above table we find that structure of the current liabilities is increased during the years 2010 to 2013 with respect to Current Assets. The average value is 320.7 which is higher than the value of Current Liabilities in the years 2010 and 2011.
Structure of the Average of current liabilities of ITC-PSPD Ltd
STATEMENT OF CHANGES IN WORKING CAPITAL
Statement of changes in working capital of ITC-PSPD Ltd during the year 2010-2013
Particulars | 2010 | 2011 | Increase | Decrease |
Current Assets | ||||
Inventories | 401.64 | 525.06 | 123.42 | - |
Sundry debtors | 146.57 | 159.13 | 12.56 | - |
Cash & Bank Balances | 1.73 | 0.56 | - | 1.17 |
Interest Accrued on Loans & Deposits | 0.15 | 0.09 | - | 0.06 |
Deposits | 8.92 | 8 | - | 0.92 |
Loans & Advances | 97.74 | 127.66 | 29.92 | - |
Total CA (A) | 656.74 | 820.49 | ||
Current Liabilities | ||||
Hundies & Acceptances | 1.19 | 0.93 | - | 0.26 |
Sundry Deposits | 12.7 | 15.33 | 2.63 | - |
Sundry Creditors | 243.21 | 165.17 | - | 78.04 |
Provisions | 41.27 | 117.94 | 76.67 | - |
Total CL(B) | 298.37 | 299.37 | ||
Net Working Capital (A-B) | 358.37 | 521.12 | ||
Increasing In W.C | 162.75 | 162.75 | ||
521.12 | 521.12 | 86.6 | 86.6 |
Interpretation:
From the table we find the Current Assets has been increased by over all value but the values of Cash & Bank balances, Interest Accrued on Loans & Deposits and Deposits has been decreased. Current Liabilities is also has been increased except Hundies & Acceptances and Sundry Creditors. The Net Working Capital has been increased by 162.75Crs.
Statement of changes in working capital of ITC-PSPD Ltd
Statement of changes in working capital of ITC-PSPD Ltd during the year 2010-2013
Particulars | 2011 | 2012 | Increase | Decrease |
Current Assets | ||||
Inventories | 525.06 | 607.34 | 82.28 | - |
Sundry debtors | 159.13 | 201.36 | 42.23 | - |
Cash & Bank Balances | 0.56 | 2.69 | 2.13 | - |
Interest Accrued on Loans & Deposits | 0.09 | 0.09 | 0 | - |
Deposits | 8 | 10.46 | 2.46 | - |
Loans & Advances | 127.66 | 138.44 | 10.78 | - |
Total CA (A) | 820.49 | 960.38 | ||
Current Liabilities | ||||
Hundies & Acceptances | 0.93 | 2.07 | 1.14 | - |
Sundry Deposits | 15.33 | 18.25 | 2.92 | - |
Sundry Creditors | 165.17 | 167.04 | 1.87 | - |
Provisions | 117.94 | 130.9 | 12.96 | - |
Total CL(B) | 299.37 | 318.26 | ||
Net Working Capital (A-B) | 521.12 | 642.12 | ||
Increasing In W.C | 121 | 121 | ||
642.12 | 642.12 | 120.99 | 121 |
Interpretation:
From the table we find out that the Current Assets and Current Liabilities have been increased in all the particulars. The overall Net working Capital has been increased by value 121.0Crs.
Statement of changes in working capital of ITC-PSPD Ltd