Elementary Statistics: A Brief Version(A. Bluman 3rd Ed., 2003): OUTLINE of Chapter 1.
OUTLINE of Chapter 1
Elementary Statistics: A Brief Version
(A. Bluman 3rd Ed., 2003)
Demonstrate knowledge of statistical terms.
Differentiate between the two branches of statistics.
Identify types of data.
Identify the measurement level for each variable.
Identify the four basic sampling techniques.
Explain the difference between an observational and an experimental study.
Explain how statistics can be used and misused.
Explain the importance of computers and calculators in statistics.
Statistics is the science of conducting studies to collect, organize, summarize, analyze, and draw conclusions from data.
Descriptive statistics consists of the collection, organization, summarization, and presentation of data.
Inferential statistics consists of generalizing from samples to populations, performing estimations hypothesis testing, determining relationships among variables, and making predictions.
Probability is the chance of an event occurring.
A population consists of all subjects that are being studied.
A sample is a group of subjects selected from a population.
In order to gain knowledge about seemingly haphazard events, statisticians collect information for variables that describe the events.
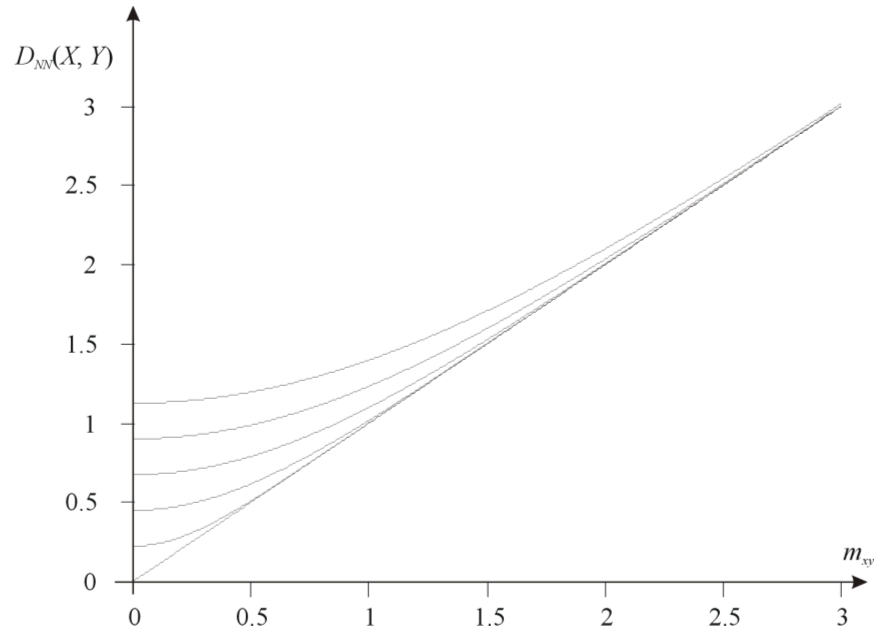
A variable is a characteristic or attribute that can assume different values.
Data are the values that variables can assume.
A data set is a collection of data values.
Each value in the data set is called a data value or a datum.
Random variables have values that are determined by chance.
Insurance companies set their rates based on random variables. Over a long period of time, the rate of the occurrence of accidents tends to be constant.
Qualitative variables can be placed into distinct categories according to some characteristic or attribute.
Quantitative variables are numerical in nature and can be ordered or ranked.
Variables and Types of Data (cont'd.)
Quantitative variables can be further classified into two groups.
Discrete variables assume values that can be counted.
Continuous variables can assume all values between...
Reviews of: "Elementary Statistics: A Brief Version(A. Bluman 3rd Ed., 2003): OUTLINE of Chapter 1."
:
More Mathematics
essays:
Outline of Chapter 7 text - Elementary Statistics: A Brief Version(A. Bluman 3rd Ed., 2003)
... The population standard deviation must be known or be able to be estimated. The maximum error of the estimate must be stated. Conclusions Estimation is an important aspect of inferential statistics ...
OUTLINE of Chapter 3: Elementary Statistics: A Brief Version, (A. Bluman 3rd Ed., 2003).
... The variance and standard deviation are used quite often in inferential statistics. Chebyshev's Theorem The proportion of values from a data ... reveal. Conclusions By combining all of these techniques together, the student is now able to collect, organize, summarize and ...
Outline of Chapter 8 text - Elementary Statistics: A Brief Version(A. Bluman 3rd Ed., 2003)
... the population under study, state the particular hypotheses that will be investigated, give the significance level, select a sample from the population, collect the data, perform the calculations required for the statistical test, and reach a conclusion. Hypothesis Testing Hypotheses ...
Outline of Chapter 9 text - Elementary Statistics: A Brief Version(A. Bluman 3rd Ed., 2003)
... no relationship between the subjects in each sample. The populations from which the samples were obtained must be normally distributed, and the standard deviations of the variable must ...
Outline of Chapter 5 text - Elementary Statistics: A Brief Version(A. Bluman 3rd Ed., 2003)
... Discrete Probability Distribution A discrete probability distribution consists of the values a random variable can assume and the corresponding probabilities of the values. The probabilities are determined theoretically or by observation. Calculating the ...
Outline of Chapter 6 text - Elementary Statistics: A Brief Version(A. Bluman 3rd Ed., 2003)
... 6 Outline Identify distributions as symmetrical or skewed. Identify the properties of the normal distribution. Find the area under the standard normal distribution, given various z values. Find the probabilities for a normally distributed variable by ...
OUTLINE of Chapter 4 text - Elementary Statistics: A Brief Version (A. Bluman 3rd Ed., 2003)
... the sample space that are not included in the outcomes of the event itself. Complementary events are mutually exclusive. Summary Rule Definition Conclusions Probability can ...
A brief essay about Carl Gauss written for my statistics class.
... mathematicians of modern time. His work in the areas of statistics, probability, astronomy and geodesy, among other fields, established basic principles in ...
Elementary Statistics
This essay really helped me answer questions for class. I think it's an excellent essay!
2 out of 2 people found this comment useful.