How the resistance of a wire changes with different lengths Planning We are trying to find out if and how the resistance of a wire changes by adjusting the length of the wire. I think that as the length increases; the resistance will also increase. I think this will happen because in previous experiments, my results have shown this. For example: I have done an experiment where I had to find out what variables affected the resistance of a wire. I set up a circuit similar to the one in the diagram below. But instead of keeping all the variables the same, I changed them, one at a time, to see what effect they may have on the resistance of a wire.
Predicted Graph Circuit Diagram The apparatus I will use is: battery pack, leads, ammeter, constantan wire (0.25 mm), ruler, crocodile clip and a voltmeter.
I did a practical in which I chose to use constantan wire.
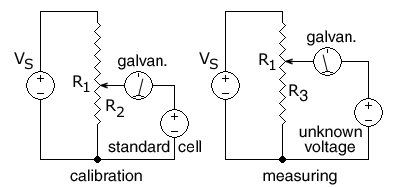 A potentiometer being calibrated and then measurin...
 tribune Chávez & monarch of Spain indict each oth...
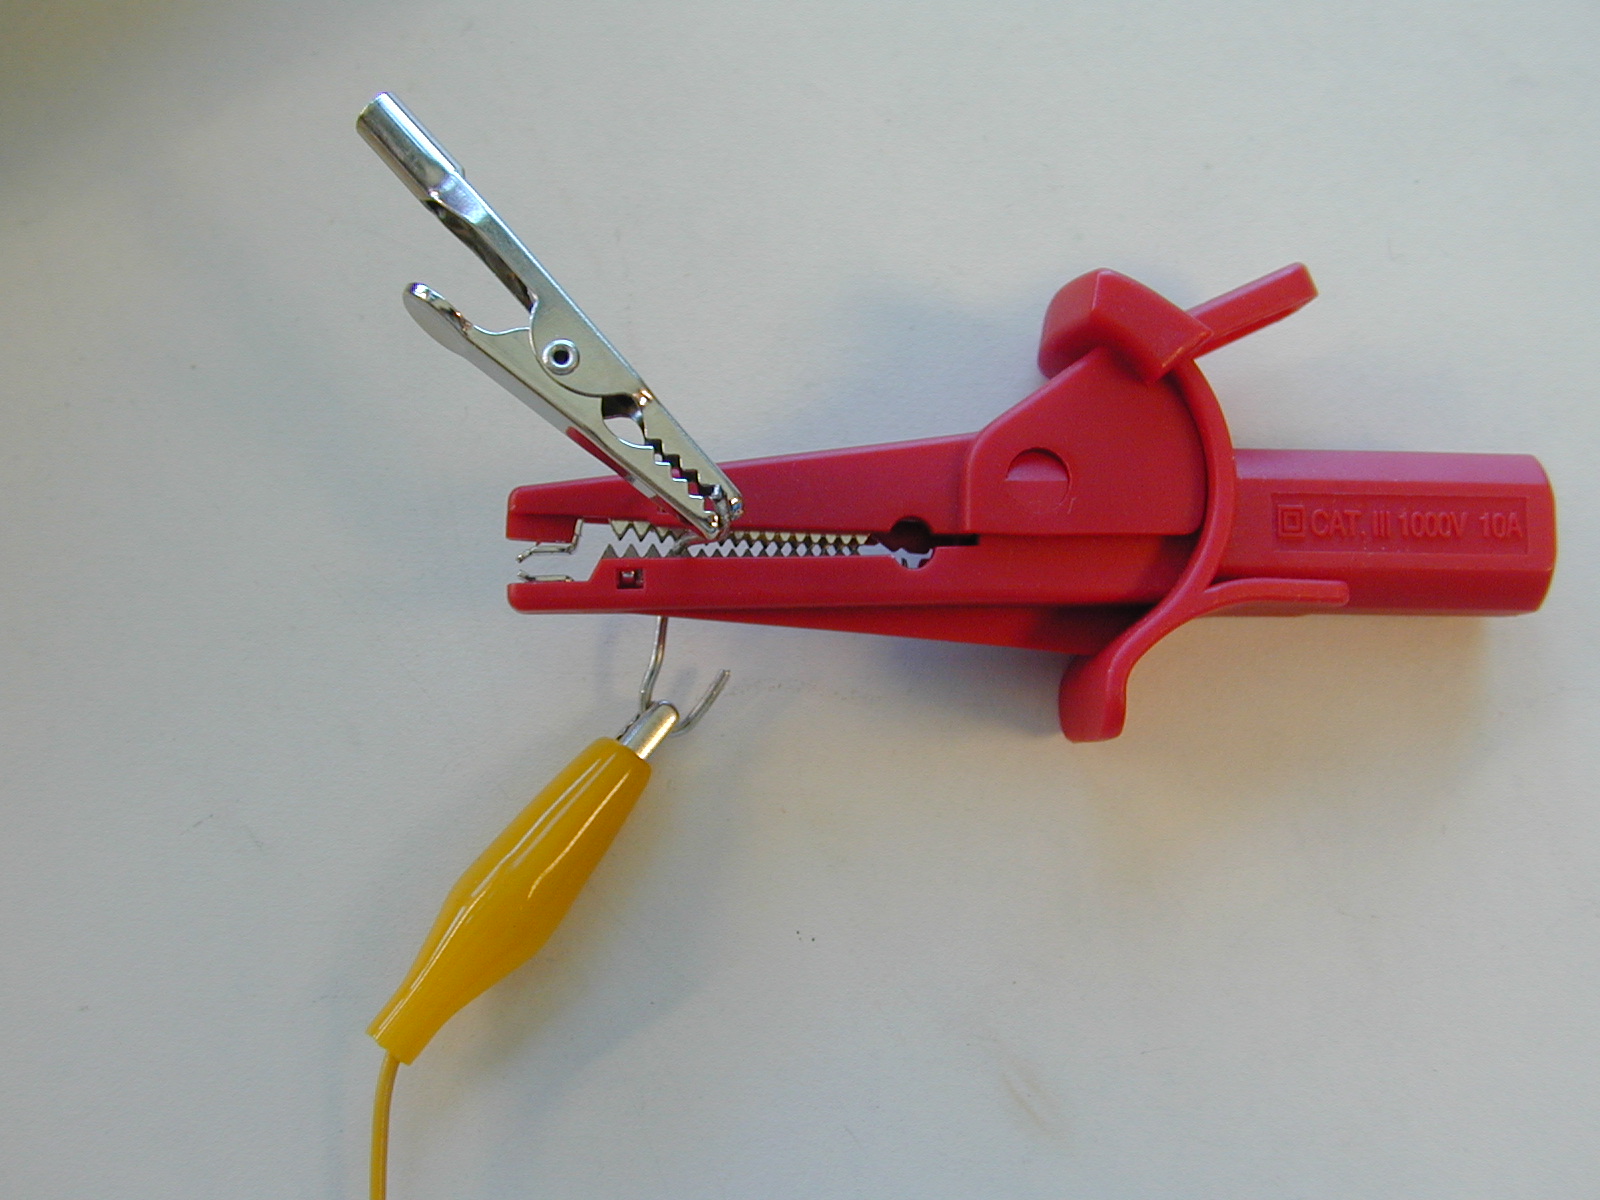 Three alligator clips: A naked standard-sized clip...
It provided me with a good range of results. This led to my decision to use constantan wire in my investigation. There are a few ways in which I want to make this investigation fair. There are four variables. They are: amount of current, temperature, diameter and length of wire. In order to gain the results to what I am trying to find out, I must keep all the variables the same apart from the length. I will not alter the amount of cells that I use, as this will affect the current, and therefore it will affect my resistance result. I will record the results of each length, and "ÃÂbreak' the circuit quickly. By "ÃÂbreaking' the circuit I mean disconnecting one of the wires. This will reduce the chance of getting a "ÃÂheating effect'. The "ÃÂheating effect' is an effect that temperature has on the wire. It occurs when there is too much current flowing through a resistance wire. As the wire becomes hotter, the atoms in the metal vibrate faster. This makes it harder for "ÃÂfree electrons' to pass through the wire. This is because the electrons collide with the atoms. This is called "ÃÂcollision theory'. It can be compared with a person running through a corridor full of people. If the people (atoms) are still, then it is relatively easy for the person to run through; but if the people are moving, then it is harder for the person to run through. Due to this, the resistance goes up. Due to an experiment that I did last year, I know that changing the diameter of a wire, changes the amount of current that can flow through it. The thicker the wire, the more current can flow through it. Therefore it is important to keep the diameter and type of wire the same. In some wires there are more "ÃÂfree electrons' i.e. more current can flow through it. There is going to be one calculation that I will need to do after I have obtained my results. I will have obtained readings for current, length and voltage. In order for me to come to a sensible conclusion, I will need to know the relationship between Resistance and Length of wire. In order for me to be able to calculate the Resistance, I will need to apply a calculation to my results. That calculation is: Resistance = Voltage Current. I am going to plot my results on an X-Y scatter graph using a line of best fit to be able to read the graph more clearly.
I am going to set up a circuit as shown in the diagram. I am using 3V in my battery pack. I will use the ammeter to record the current. The current must remain constant. The wavy line is the resistance wire. I will set up a voltmeter in parallel to the resistance wire. One end of the lead connected to the voltmeter will be fixed and the other lead will be plugged into a crocodile clip which I will clip onto the resistance wire at 10 cm intervals, measured along the ruler.
Physics Coursework Friday, 09 March 2001 Alex Hall (J) How the resistance of a wire changes with different lengths Obtaining Evidence In order to gain a good range of results, I decided to repeat the experiment three times and take an average. I have plotted the average resistance results against the different lengths. In order to make the graph clear, I have decided to use increments of 10 cm from 0 cm up to 100 cm of length. This makes sure that the results are accurate. In each of the three tests, the resistance results have been roughly the same for each length. For example: 80 cm of wire gave voltage readings of 1.63V, 1.63V and 1.65V. That is an average of 1.64V (3 significant figures). This makes them clear to read off the graph.
Test One Length of Wire (cm) P.d. across wire (V) Resistance ( ) 100 2.14 13.38 90 1.85 11.56 80 1.63 10.19 70 1.42 8.88 60 1.16 7.25 50 1.00 6.25 40 0.80 5.00 30 0.61 3.81 20 0.41 2.56 10 0.21 1.31 0 0.00 0.00 Test Two Length of Wire (cm) P.d. across wire (V) Resistance ( ) 100 1.97 12.31 90 1.77 11.06 80 1.63 10.19 70 1.45 9.06 60 1.25 7.81 50 1.05 6.56 40 0.84 5.25 30 0.64 4.00 20 0.47 2.94 10 0.28 1.75 0 0.00 0.00 Test Three Length of Wire (cm) P.d. across wire (V) Resistance ( ) 100 2.08 13.00 90 1.86 11.63 80 1.65 10.31 70 1.44 9.00 60 1.23 7.69 50 1.04 6.50 40 0.84 5.25 30 0.64 4.00 20 0.43 2.69 10 0.23 1.44 0 0.00 0.00 Average Results Length of Wire (cm) P.d. across wire (V) Resistance ( ) 100 2.06 12.88 90 1.83 11.44 80 1.64 10.25 70 1.44 9.00 60 1.21 7.56 50 1.03 6.44 40 0.83 5.19 30 0.63 3.94 20 0.44 2.75 10 0.24 1.50 0 0.00 0.00 Physics Coursework Friday, 09 March 2001 Alex Hall (J) How the resistance of a wire changes with different lengths Conclusion The constantan wire that I used in my investigation could be described as Ohmic. Ohmic in the sense that it follows Ohm's law. Ohm said that "ÃÂfor some conductors, the current flowing is proportional to the voltage, provided the temperature remains constant'. This is true for my results. I drew a line of best fit to make it easier to read the results off the graph. I think that the speed of my recordings, contributed towards the straight line. Temperature is one of the variables that affects the resistance of a wire. I recorded my results instantly to reduce the possibility of temperature rising. For details, see prediction. I predicted that as the length increases, so would the resistance. I could have been more precise and said that the resistance was directly proportional to the length. In my original prediction I said that the graph would be a straight line and not a curve. If the graph were a curve then we would have to expect that the wire heated up. This is because as the wire gets longer, the resistance increases, but it is not only that change. The "ÃÂheating effect' also changes it. The resistance will go up.
Physics Coursework Friday, 09 March 2001 Alex Hall (J) How the resistance of a wire changes with different lengths Evaluation I think that this experiment went well. I got accurate results and an expected graph. My results were reliable and expected. Everything went fine but I could maybe improve on the accuracy in the cutting of the wire and the recording of the amps and volts. A computer could be used to gain accurate results. There may be some way for a computer to record the current and voltage readings accurately. I rounded my results to 3 significant figures. I may get more precise results by rounding to 7 or 8 significant figures. However this may look untidy, when put into a table. I think that my results are a good set of results and I would rely on them to be correct in the future. There is something that I would add to my method. That is a thermometer. If I was to take temperature very seriously, I could check to see if the wire stayed at the same temperature. If I repeated this experiment, I would prefer to plot a graph with twenty points on it, rather than ten. Therefore I would decrease the change in wire length to 5cm intervals. I could do some further research on the effect that the diameter of the wire has on the resistance.
In my investigation, I used the following references: -Physical Processes Text Book -www.gcsescience.co.uk -www.homeworkresource.co.uk
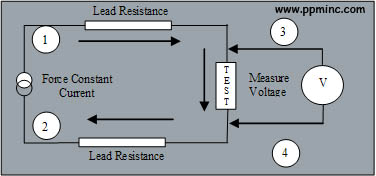 English: Low resistance measurement using 4 wire (...
 English: Wire Wound Platinum Resistance Thermomete...
 blog
blog English: Three-wire configuration of a resistance ...
 English: Four-wire configuration of a resistance t...