�
Case Introduction
Electro Industries are a large diversified manufacturer of computer systems, industrial electronics, electronic components and consumer electronics and a supplier of a broad range of services.
Problems confronting Electro
Electro has incurred its first loss for the company in 15 years, despite sales growth of 20%. The net loss in 1974 was $5.7 million on sales of $875 million
Operational expenses and administrative expenses soared.
Stock price is low from 1968 till 1973. Interest expenses increased because majority of the debt was short term and there was an increase in interest rate. Interest expense rose from 0.54 % to 3.7% of total sales
Decentralized structure of operations provides lesser control on the operational efficiency at the divisions.
Corporate cash flow situation
Overall, from the balance sheet, we can see that the cash available in 1974 is 2.89% of the total sales, which is lower than that of 1973.
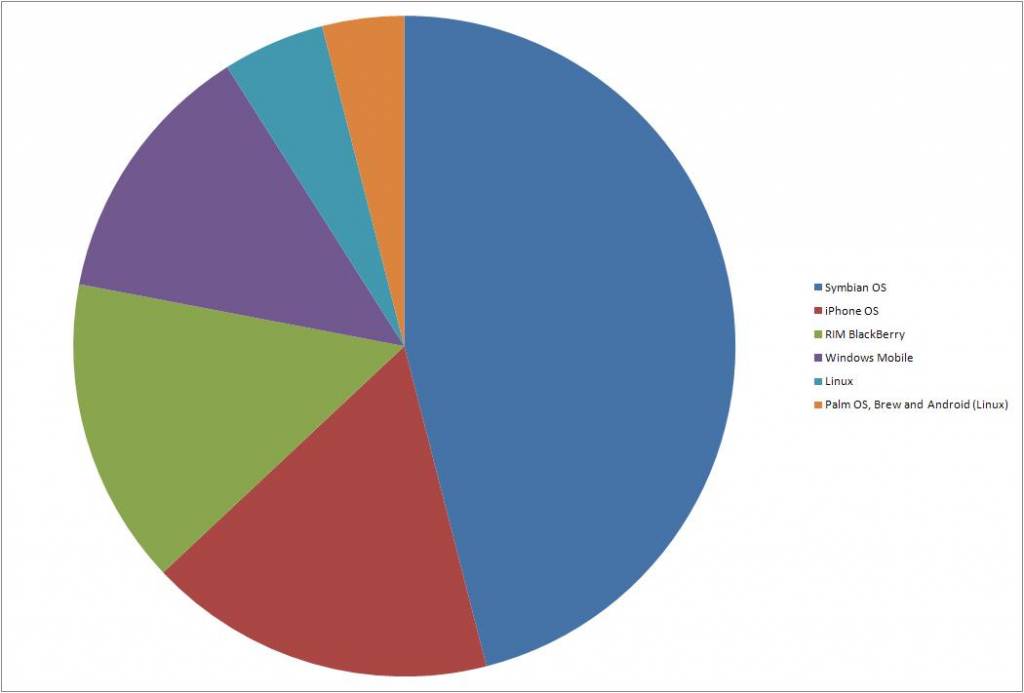 Market share of mobile os s 2008
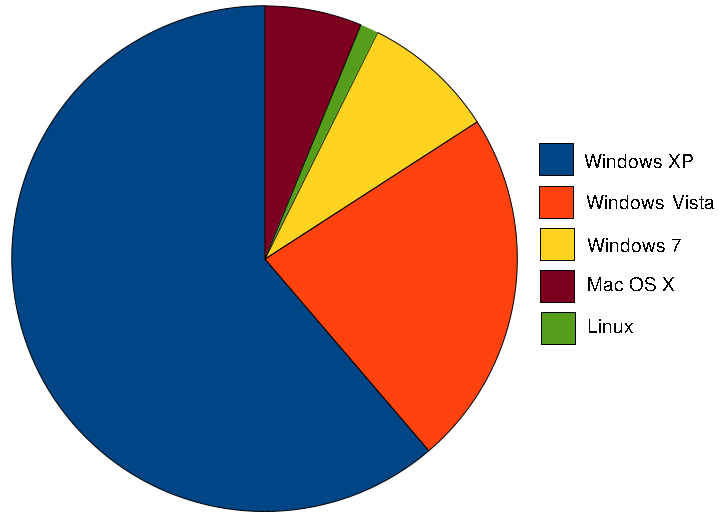 OS market share - Janurary 2010
 Graph of the TNS Market Share for the top 4 UK Sup...
Only K, N, Q, T, W & X have increase in their positive cash flows, and U & V have an improvement in their cash flows but it is still negative. All other products have had a decrease in their cash flows in 1974 as compared to 1973.
All these have managed to increase their market share, except Q.
K, Q, V & W have high market growth rate. N, T & U have medium growth and X has low market growth rate.
In 1974, the highest cash flow was seen in products A,B, D, L,N, P, S. All others had a decrease in their cash flow as compared to 1973's cash flows.
Product Group | Quadrant Changes | Market Share Change from 1973 to 74' | Long term Market Growth | Cash Flow |
A | Cash Cow | Increased by 4.8% | Low (7.5%) | 6.3 |
B | Dog | Increased by 26% | Low (7.3%) | 1.2 |
D | Cash cow, moving into Dog Quadrant | Decreased by 1.9% | Very Low (2.8%) | 1 |
L | Cash Cow | Increased by 13.5% | Very Low (2.8%) | 3.7 |
N | Star | Increased by 7.7% | Medium 9(12%) | 1.3 |
P | Cash Cow (borderline with star quadrant) | Increased by 3.8% | Medium (9.5%), | 1.9 |
S | Question Mark | Increased by 8.7% | Medium (12.7%) | 1 |
The lowest cash flow is observed for J,M, U, V, Y and Z.
Product Group | Quadrant Changes | Market Share Change from 1973 to 74' | Long term Market Growth | Cash Flow |
J | Question Mark | Increased by 29% | High (15.5%) | -1.3 |
M | Cash Cow | Decreased by 8% | Low (6%) | -1.4 |
U | Question Mark | Increased by 6.25% | Medium (14%) | -1.5 |
V | Question Mark | Increased by 31% | High (20%) | -1.2 |
Y | Question Mark | Decreased by 28% | Highest (30%) | -1.4 |
Z | Dog | Increased by 50% | Low (8.7%) | -1 |
Learning from Exhibits 3, 4 & 5
From Exhibit 3 & 4, we can find the position and trajectory being followed by each product within Electro Inc. We can classify the products as Cash cow, Dogs, Stars and Question Marks and analyze them accordingly. Based on this analysis, we can decide whether to build the market share, hold the market share, focus on certain segments, abandon the product or divest the entire subsidiary. From Exhibit 5 we can confirm if the suggestions given by Mr. Weatherby are accurate or not.
For individual Products, the analysis is as follows
Cash Cows:A, D, E, F, L, M, P
Only M has negative Cash flow which maybe because of the decrease in market share due to some competition. M is still the market leader, and can try and regain market share through Hold strategy, via increased advertising, etc.
For A, F, L and P themarket share has increased, but the cash flow(even though positive) has decreased from previous year. This may also be because over-investment, which resulted in lower cash flow and small increase of market share. The investments for these products should be limited to maintain their market share. Hold Strategy needs to be employed here.
For D & E, the market share has decreased and for themand Build strategy would be required. As they are market leaders, they can lower their prices and regain market share.
Dogs: B, C, H, I, T, X & Z
B, T, X & Z have increase in market share due to larger investments and C, H & I have decrease in market share, which implies they have been cash traps.
B, T & X have increasing market share and comparatively higher market growth. Hence, they can be divested.
C, H & Z have very low cash flow and market share and would require extremely large investments to sustain and no one would buyout the company. But as this isnot viable to continue, so they should be harvested to gain short term earnings and eventually abandoned.
I has comparatively higher market share, but very low growth rate. So it is best to harvest it for short term gains.
Question marks: J, K, O, R, S, U, V, W, Y
J, U, V & Y have high growth rates, but negative cash flows. J, U & V have increasing market share also. So for these it is better to adopt a focus strategy is required, concentrating on a few segments only. For Y (MOStronics), focus on Calculators would be better.
K & W have high Growth rate and positive cash flows. They need to have build share strategy.
O, R & S have medium growth rate and cash flows are decent, so focus strategy is better
Stars: G, N & Q
G& Q have higher growth rate, but have lost little market share.So Build share strategy is better suited for them.
N has lower growth rate and decreased market share, so it better to have hold share strategy.
Learning from Exhibits 6, 7 & 8?
Exhibits 6, 7 and 8 shows the Market Share, growth potential and financial status vis-a-vis its competitors.
MOStronics which has the highest growth of about 30% has four products.
Personal Calculators
MOS Integrated circuits
MOS RAM Memory Circuits
MOS Digital Logic
Custom MOS Circuits
The Personal Calculator unit of MOStronics has a market share of about of 4.75% where the Market leader has 33% thereby posting a relative market share of 15.83%. The market growth rate is about 30% and a $350M market already. The product falls under the category of Question mark. The market leader in the segment is TI who has pretty deep pockets with total assets of $828M. This might be too tough a competitor to displace. The company should try to preserve the market share and grow along with the market's pace, but always eying for growth as well.
The MOS RAM Memory Circuits of MOStronics has a relative market share of about .16%. The market growth rate is about 27% and a $100M market. The product falls under the category of Question mark. The market leader in the segment is AM who has total assets of $48.7M. This might be the market they can concentrate on with decent market and good growth. The company should try to expand and invest in this segment.
The MOS Digital Logic of MOStronics has a relative market share of about .2%. The market growth rate is about 24% and a $350M market already. The product falls under the category of Question mark. The market leader in the segment is Intel who has total assets of $50.6M. This should be the market they must concentrate on with huge market and good growth. The company should expand and invest heavily in this segment.
The Custom MOS circuit of MOStronics has a relative market share of about .15%. The market growth rate is below 10% and only a $50M market. The product falls under the category of Dog. The market leader in the segment is Mostek. This segment should be left alone without any investment or probably a segment better to quit.
Recommendations as a member of the Board:
In terms of further analysis
Analysis of the other products of the competitors along with the growth-gain matrix, in order to evaluate the trajectory followed by each product and the strategies employed by the competitors.
The analysis of the financial balance of the strategies employed by Electro Inc. We need to analyze the amount of internal funding generated by the Cash cows, harvested Dogs and Question marks. And we need to find out the amount of investment required for each product and estimate the overall amount of external funding required to compensate the lack of internal funds.
In terms of specifications
Build Strategy for D, E, G, K, Q & W
Hold Strategy for A, F, L, M, N & P
Focus Strategy for J, O, R, S, U, V& Y
Harvest Strategy for C, H, I & Z
Divest Strategy for B, T & X
Electro Industries Inc.
Strategic Marketing
ARUN Krishna t Dhiraj Kumar R Ramkumar Ruchita Das
�pg. � PAGE \* MERGEFORMAT �2� Electronic Industries Inc. Strategic Marketing